The first two lines to read on a fiber connector inspection scope datasheet are which magnification and which image the field of view belongs to, and which edition of IEC 61300-3-35 the automatic pass/fail uses. In the documents reviewed, the horizontal width of the single-fiber field of view was 370 µm at high magnification and 740 µm at low magnification on the VIAVI P5000i, 610 µm on the Fluke FI-3000 and 750 µm on the EXFO FIP-500. Set side by side, the figures differ by more than a factor of two, but nothing in the documents guarantees that they were measured on the same image under the same rule.
Documents checked on November 5, 2026: the manufacturer and organization documents listed under Sources.
Learning objectives
-
Find the magnification, the image type (live or analysis) and the single-fiber or multi-fiber designation next to a scope's field of view figure, and decide whether documents can be compared on the same line.
-
Separate resolution, particle detection size and sensor pixel count as different pieces of information, and calculate how much length one pixel covers from the field of view and the pixel count.
-
Carry the IEC 61300-3-35 edition, the profile and the tip behind an automatic pass result into the inspection record.
Which image does a scope datasheet's field of view belong to?
Field of view (FOV, the size of the area visible at one time) is often stated several times for one instrument, depending on magnification and image type. The VIAVI P5000i datasheet gives 740 × 550 µm at low magnification and 370 × 275 µm at high magnification, exactly a factor of two apart, and the same document describes the instrument as dual magnification, 200X and 400X. The Fluke FI-3000 datasheet gives a single line, 610 × 460 µm, in its specification table. The same product's user manual has that line and adds a separate live image field of view of at least 4800 × 1600 µm at low magnification and 680 × 510 µm at high magnification, and the pages read contain no sentence explaining how the two relate.
The EXFO FIP-500 specification sheet gives 2.03 × 5.16 mm for multi-fiber connectors and 0.75 × 0.75 mm for single fibers, and a footnote on the pass/fail line, footnote b, says full SFOV and partial LFOV. SFOV is the small field of view used for the core, the cladding and the contact zone of a single fiber, and LFOV is the large field of view used to see a whole MPO ferrule. The minimum sizes come from a Fluke technical blog post of 2025-04-30 describing IEC 61300-3-35: at least 6.4 × 2.5 mm for LFOV and at least 250 µm for SFOV. That is the blog's description, and the standard text itself was not read.
DMS interpretation: when you copy a field of view figure into a comparison table, put the magnification, the image type and the single-fiber or multi-fiber designation in the same cell. For example, a typical 125 µm cladding takes 33.8% of the horizontal width of the VIAVI high-magnification view, 16.9% of the low-magnification view, 20.5% of the Fluke 610 µm and 16.7% of the EXFO 750 µm. Against a 2.5 mm ferrule diameter, the VIAVI low-magnification view shows 29.6% of the width at one time and the high-magnification view shows 14.8%. The FOA document introduces single-fiber connector ferrules as 2.5 mm or 1.25 mm. These percentages are DMS arithmetic on the datasheet figures, not values published by a manufacturer.
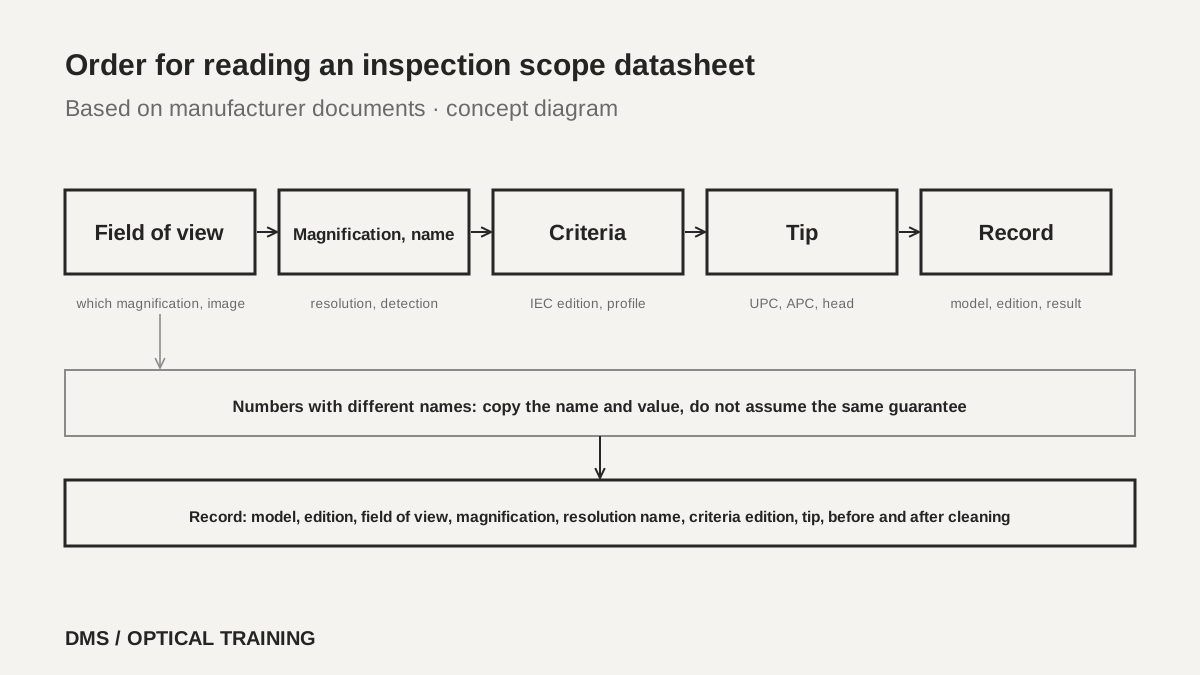 Order for reading an inspection scope datasheetView original
Scroll horizontally to view a wide table.
| Document and edition | Field of view | Magnification and image | Conditions stated alongside |
|---|---|---|---|
| VIAVI P5000i data sheet (document number 30168437 907 0423, 2023, search-listing date 2023-04-18) | Low magnification 740 × 550 µm, high magnification 370 × 275 µm | 200X and 400X, live image 640 × 480 pixels at 8 fps | Typical values at 25 °C |
| Fluke FI-3000 data sheet (Rev. 2019-03-04, literature ID 7002773) | 610 × 460 µm | No magnification figure, 5 MP camera | No image type stated |
| Fluke FI-3000 user manual (search-listing date 2025-09-12) | Live low magnification at least 4800 × 1600 µm, high magnification 680 × 510 µm, and separately 610 × 460 µm | Live image about 1200 × 400 pixels at 10 fps | For MPO, 1 × 8 up to 2 × 16 fibers |
| EXFO FIP-500 specification sheet (FIP500.12EN, marked 2025-08, search-listing date 2025-07-29) | Single 0.75 × 0.75 mm, multi-fiber 2.03 × 5.16 mm | No magnification figure, two 5 MP sensors | Full SFOV and partial LFOV |
-
Write a field of view figure on the same line as its magnification, image type and single or multi-fiber designation
-
One instrument can have a live image field of view and a specification-table field of view stated separately
-
A larger field of view shows more at once, and higher magnification makes small defects look larger
Are magnification, resolution and particle detection size the same number?
They are three different pieces of information, and documents use different names for them. The VIAVI P5000i data sheet states particle size detection of less than 1 µm, while the June 2023 getting started guide for the same instrument (ZP-PKG-0574 Rev. 501) states the same figure under the name resolution, less than 1 µm. The Fluke FI-3000 states a resolution of 1 µm. In the EXFO FIP-500 sheet no resolution or detection size line was found. What EXFO states instead is the optical build: two 5 MP sensors, violet LEDs at 415 ± 15 nm and pulsed coaxial illumination.
Magnification figures also vary. VIAVI states dual magnification, 200X and 400X, while the Fluke and EXFO documents contain no magnification figure. The FOA document says fiber inspection microscopes range from 30 to 800 power, that 100 to 400 power is the most widely used range, that higher magnification helps find polish defects and scratches where you look for micron-sized defects, and that lower magnification shows more of the connector when you look for dirt. Screen enlargement on a video image does not mean the same thing as optical magnification, so do not set the magnification figure of a video scope against that of an optical microscope on the same line.
Where the field of view and the pixel count are both stated, as for the VIAVI, you can calculate how much length one pixel covers. Dividing 740 µm of low magnification by the 640 pixels of the live image gives 1.16 µm per pixel, and dividing 370 µm of high magnification gives 0.58 µm. If the 2560 horizontal sensor pixels are assumed to cover the whole field, the figures are 0.29 µm and 0.14 µm. The 2 µm defect size of the SFOV requirement described in the Fluke blog is therefore about 1.7 pixels across in the low-magnification live image and about 3.5 pixels in the high-magnification one. This is DMS arithmetic on two figures and is not a guarantee of optical resolution or detection performance.
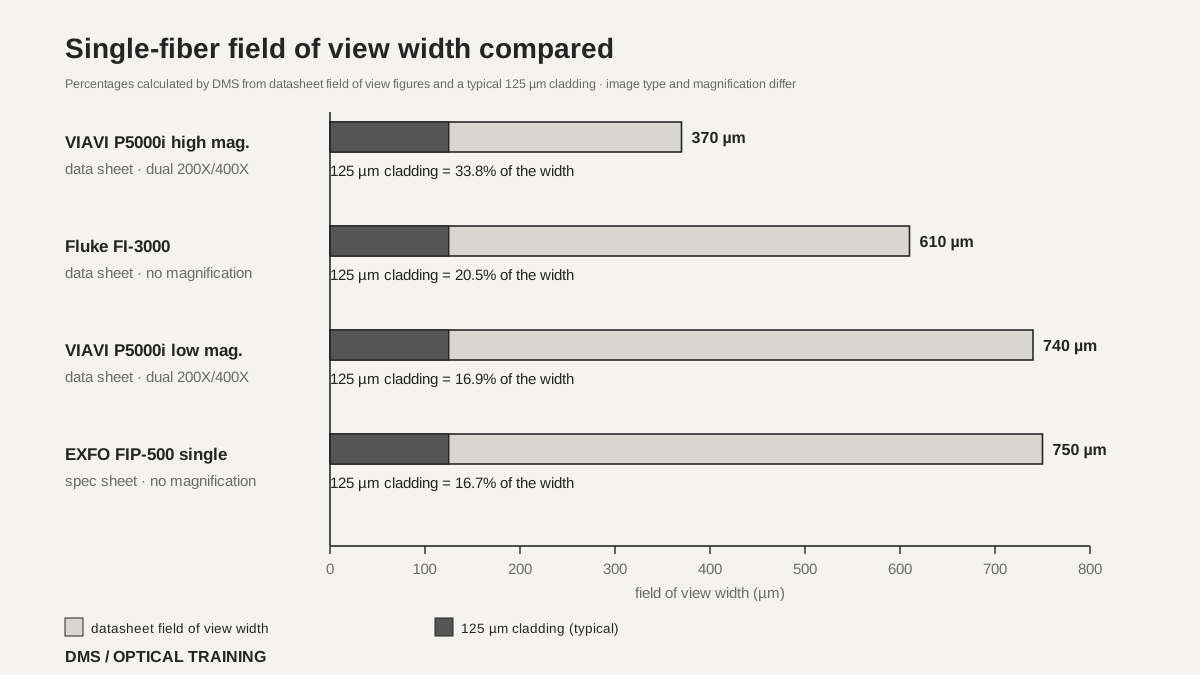 Single-fiber field of view width comparedView original
Scroll horizontally to view a wide table.
| Item | VIAVI P5000i | Fluke FI-3000 | EXFO FIP-500 |
|---|---|---|---|
| Name given to resolution or detection size | Data sheet: particle size detection under 1 µm; guide: resolution under 1 µm | Resolution 1 µm | No such line found |
| Camera sensor | 2560 × 1920, 1/2.5-inch CMOS | 5 MP, 1/4-inch CMOS | Two 5 MP sensors |
| Illumination | Blue LED, coaxial, 100,000 hour or longer life | Blue LED, coaxial, separate white LED for the port | Two violet LEDs at 415 ± 15 nm, pulsed coaxial |
| Time for automatic pass/fail | No such line found | Under 2 seconds per fiber | MPO-12 10 s, MPO-24 15 s, single fiber 4 s (typical) |
| Operating temperature | 0 to 40 °C | -10 to 45 °C | -10 to 40 °C |
-
Do not assume that a resolution figure and a particle detection size figure of the same value are the same guarantee
-
When a document has no magnification figure, compare by field of view and pixel count
-
The length one pixel covers is a DMS calculation of field of view divided by pixel count
Which edition does the pass/fail decision follow?
An automatic scope decides pass or fail with the IEC 61300-3-35 edition and profile named on the datasheet's criteria line, and when the edition differs the same end face can receive a different result. The Fluke blog explains that the standard was revised from a first edition in 2009 to a second in 2015 and a third in 2022. The 2015 edition graded the size and number of defects in four zones, the core (A), the cladding (B), the adhesive (C) and the contact zone (D). According to the blog, the 2022 edition removes zones C and D from the pass/fail criteria, has you inspect and clean the contact zone first, and treats particles that remain after several cleaning attempts as embedded defects that are accepted.
The blog goes on to say that the third edition added wording under which a connector that has been cleaned of loose debris but still fails inspection may be used if it passes insertion loss and return loss testing. That is Fluke's explanation and not a reading of the standard text. This lesson therefore stops at what the documents describe, and the idea that optical testing takes precedence over inspection should be applied only after you confirm that your purchase specification or contract says the same.
The product documents state the edition as follows. The 2019 Fluke FI-3000 data sheet lists test limits of IEC 61300-3-35 ED. 2 multimode, ED. 2 single-mode APC, and a document-only setting. The 2025 EXFO FIP-500 sheet lists ED.3 (2022), the 2015 edition and user-set criteria, and the overview pages of the same sheet say that, in the latest software release, tapping a SmarTip on the unit automatically adjusts the pass/fail thresholds to the connector type. VIAVI says profiles matching IEC-61300-3-35 come pre-loaded on its platforms and that FiberChekPRO software can create custom profiles, but the VIAVI documents read give no edition year.
DMS interpretation: when two scopes disagree, compare the edition, the profile, the field of view and the tip before suspecting a faulty instrument. The EXFO field of view of 5.16 × 2.03 mm is 80.6% and 81.2% of the 6.4 × 2.5 mm LFOV minimum quoted in the Fluke blog, which does not contradict the partial LFOV footnote in the sheet. The sheet does not say which direction each figure runs, and whether EXFO uses this view to judge the whole MPO ferrule could not be confirmed from the pages read. As for which edition a currently sold Fluke model uses, the 2019 data sheet says ED. 2 and the 2025 blog says the tools were updated to the latest edition, so only the difference in document dates could be established.
-
Write the IEC 61300-3-35 edition and the profile on the same line as the criteria
-
A different edition can change the verdict on the same end face
-
When an inspection failure conflicts with an optical test pass, look at the criteria in the purchase specification first
How do tips, illumination and a human check affect the result?
Automatic pass/fail can start only when the tip matches the connector. The Fluke FI-3000 manual warns that the image will be too dark to analyze if a UPC tip is used to inspect an APC end face. It identifies UPC tips as blue and APC tips as green, and tells you to set the key position in the app so that the fiber numbers in the image agree with the numbers on the connector. The EXFO ordering information likewise lists separate MPO UPC and APC SmarTips and separates the single-fiber and multi-fiber optical heads. VIAVI states that it has over 300 tips and adapters and has you choose optical settings for the tip fitted.
The documents also keep a step where a person looks at the automatic result. The FOA document says the automatically generated report centers on the fiber and ignores the outside of the ferrule, so it might miss dirt on the ferrule that could cause problems later, and that, like many automated processes, it needs some operator review. The same document explains that new wide-field video microscopes show the whole ferrule and the inside of the connector body, which helps when checking cleanliness.
Safety is another item that is easy to miss on a datasheet. The FOA document says an optical microscope can focus any light in the fiber into the eye, that such a microscope should have an infrared filter, that you should check power levels with a power meter before inspecting, and that a video microscope is preferred because it offers no danger to the eye. FOA adds that the microscope's own adapters get dirty because dirty connectors are constantly inserted into them. The cycle of inspecting, cleaning and inspecting again appears in both FOA-8 (marked 2025-01-13) and the Fluke blog.
-
With a UPC tip on an APC end face, the Fluke manual says the image is too dark to analyze
-
Have a person look at the outside of the ferrule and the inside of the connector body as well as the automatic result
-
With an optical microscope, the infrared filter and a power check come first
How do you read this in a hypothetical case?
The situation below is hypothetical for teaching and is not a real site or measurement. The first case is two quotations. The datasheet of scope A states a resolution of 1 µm and a criterion of IEC 61300-3-35, while scope B states particle detection under 1 µm and ED.3 (2022). The two figures carry different names and should not be put on the same line, and because A has no edition, the comparison table records A as edition unconfirmed. Before copying the field of view, also confirm whether the figure is for single fiber or multi-fiber.
The second case is a 12-fiber MPO that fails on the field scope and passes on the laboratory scope. First confirm that the two scopes use the same criteria edition and profile, that the tips fit UPC or APC correctly, and that the result is the one taken after cleaning. Then check whether each scope's field of view covers the whole ferrule. The figures and results in this case are all assumptions.
-
Record a resolution figure and a particle detection size figure under their own names in the comparison table
-
Where the edition is blank, write edition unconfirmed
-
When results differ, compare the criteria, the tip, the field of view and the cleaning order in turn
What goes into an equipment selection and an inspection record?
On one line of the selection table, write the model and the optical head or tip set, the document number and edition, the field of view (with magnification and image type), the resolution or detection size with the name it carries, the sensor, the IEC edition and profile, UPC and APC support, whether the pass/fail time is a typical value, and the operating temperature. Keep the date printed in the document apart from the search-listing date. The Fluke data sheet reviewed is a 2019 edition and the VIAVI data sheet carries a 2023 copyright mark, and neither was assumed to describe a model currently on sale.
In the inspection record, keep what FOA-8 lists, the date, the operator, the equipment used, the method used, and the cable and fiber identification, and add the criteria (edition and profile), the tip type, the result before and after cleaning, the automatic result and the result a person confirmed. Storage is on the datasheets too. EXFO states internal memory for 2000 MPO-12 results or 10000 single-fiber results, and the Fluke manual allows up to 100 projects and up to 5000 cable IDs per project. The reporting tools are FiberChekPRO for VIAVI, Exchange and FastReporter for EXFO and LinkWare for Fluke.
This material is limited to three manufacturer sets (the VIAVI P5000i data sheet and guide, the EXFO FIP-500 sheet, and the Fluke FI-3000 data sheet and manual), two Fluke blog posts and two FOA documents. The IEC 61300-3-35 text and its edition-by-edition criteria tables were not read, and the minimum defect size the Fluke blog gives for LFOV was not used because the blog prints its unit as mm. The values of currently sold models, the resolution and pass/fail behavior of an actual instrument, and delivery criteria were not confirmed.
-
Write the resolution name and the criteria edition on the same line as the figure
-
In the inspection record, keep the criteria, the tip and the results before and after cleaning together
-
Write what could not be confirmed as not confirmed rather than leaving it blank
Checklist
-
Did you find the magnification, the image type and the single or multi-fiber designation next to the field of view figure on the datasheet of the scope you use?
-
Did you check what name the resolution or particle detection size is given?
-
Did you write the IEC 61300-3-35 edition and profile of the automatic pass/fail on the first line of the inspection record?
-
Did you confirm the tip matches UPC or APC, and did a person look at the outside of the ferrule and inside the connector body?
-
Did you write the datasheet edition and the document date in the comparison table?
Review questions
1. At the VIAVI P5000i high-magnification field of view of 370 µm width, what percentage of the width does a 125 µm cladding take?
Answer and explanation: 125 divided by 370 is 33.8%. At the low-magnification 740 µm it is 16.9%. This is DMS arithmetic on the datasheet figure, and 125 µm is the usual cladding diameter.
2. Is "resolution under 1 µm" on one datasheet the same guarantee as "particle detection under 1 µm" on another?
Answer and explanation: It cannot be told. VIAVI itself states the same figure as particle size detection in the data sheet and as resolution in the guide, so the name alone does not separate the guarantees. Copy the name and the figure as written and confirm in the manufacturer's documents whether the conditions are the same.
3. What problem does the Fluke manual say appears when a UPC tip is used to analyze an APC end face?
Answer and explanation: It says the image is too dark to analyze. Match the tip color (UPC blue, APC green) and the connector type first, and check the tip type first when a result looks strange.
Sources
-
VIAVI: P5000i Digital Analysis Microscope data sheet · document number 30168437 907 0423, 2023, search-listing date 2023-04-18, specifications on pages 1 to 3
-
VIAVI: P5000i Digital Analysis Probe Getting Started Guide · ZP-PKG-0574 Rev. 501, 2023-06, specifications on page 11 and profiles on page 14
-
EXFO: FIP-500 fiber inspection scope specification sheet · FIP500.12EN, marked 2025-08, search-listing date 2025-07-29, pages 2, 4 and 7
-
Fluke Networks: FI-3000 FiberInspector Pro data sheet · Rev. 2019-03-04, pages 8 to 9
-
Fluke Networks: FI-3000 FiberInspector Pro user manual · search-listing date 2025-09-12, tips on page 13, projects on page 14, image on page 18, specifications on pages 26 to 27
-
Fluke Networks: Easier Fiber End Face Inspections, Changes to IEC 61300-3-35 · 2025-04-30, manufacturer blog (not the standard text)
-
Fluke Networks: How to Choose the Best Fiber Optic Scope · no date shown, manufacturer blog
-
FOA: Inspection and Cleaning of Fiber Optic Connectors · no date shown, magnification and safety sections
-
FOA-8: Inspection and Cleaning of Fiber Optic Connectors · marked 2025-01-13, search-listing date 2025-01-14