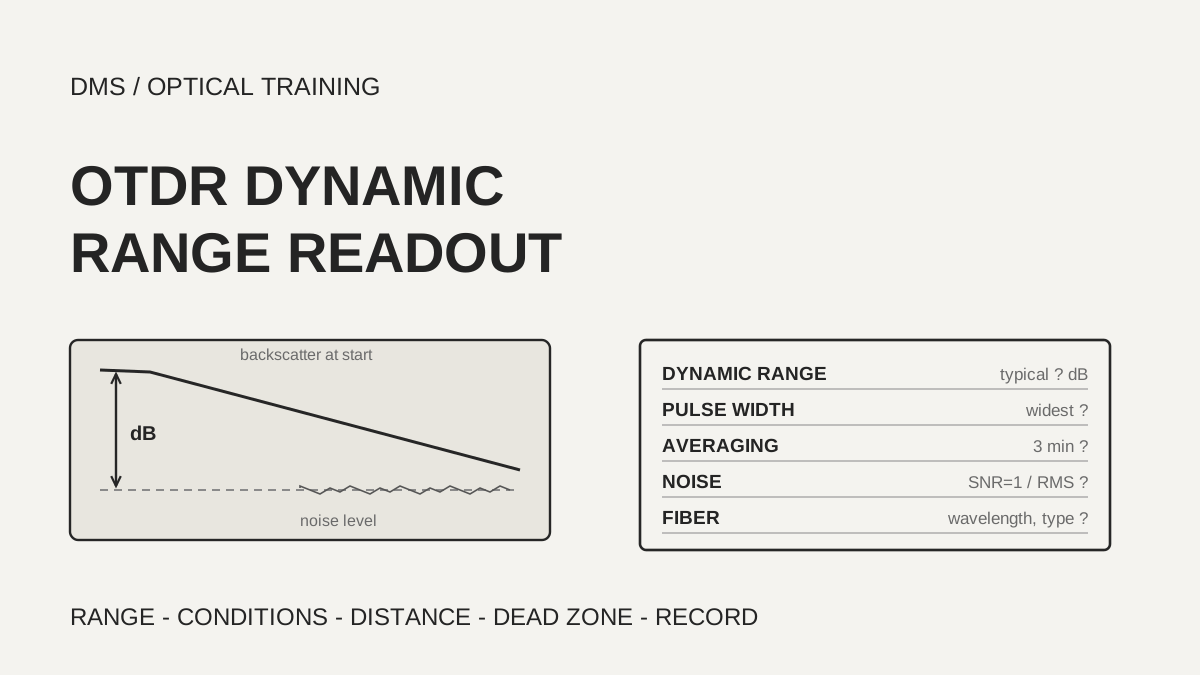
The dynamic range on an OTDR (optical time domain reflectometer) datasheet is a typical value stated for the widest pulse width, three minutes of averaging and a noise criterion of SNR=1, and it is not a loss margin you can spend on a field link. In the Fluke datasheet reviewed, an instrument with 32 dB of dynamic range at 1310 nm finds the fiber end at 80 km, which is about 25.6 dB when converted with the fiber attenuation the same document gives. When you choose an instrument, read the conditions next to the dynamic range figure and check that it is 5 to 8 dB larger than the largest loss you will meet.
Documents checked on November 4, 2026: the manufacturer and organization documents listed under Sources.
Learning objectives
-
Find the pulse width, averaging time, noise criterion, wavelength and fiber type next to an OTDR dynamic range figure, and decide whether numbers from different documents can be compared on the same footing.
-
Convert dynamic range into the distance at which the fiber end is found and the distance at which a 0.1 dB event is measured, and calculate the margin in dB.
-
Confirm that dynamic range, dead zone and the dead zone after a PON splitter are stated under different conditions, and turn that into instrument selection questions and a test record.
What conditions is an OTDR dynamic range figure stated under?
Dynamic range is the dB difference between the backscatter level at the start of the test fiber and the noise level, and the documents reviewed state it as a typical value for the widest pulse width, three minutes of averaging and SNR=1. The note in the VIAVI SmartOTDR datasheet defines it as the one-way difference between the extrapolated backscatter level at the start of the fiber and the RMS (root mean square) noise level, and adds three minutes of averaging and the largest pulse width. The Fluke OptiFiber Pro note says SNR=1 method, three minute averaging and widest pulse width, and the high dynamic range module adds a 100 km fiber length. The EXFO application note also explains that most dynamic range specifications are given at the longest pulse width, three minutes of averaging and SNR=1 (the averaged level of RMS noise), and tells the reader to read the footnotes for the test conditions.
Other conditions sit next to the figure even when that sentence is the same. The July 2006 Corning OV-1000 datasheet gives single-mode dynamic range at two pulse widths, 10 µs and 20 µs, and states the multimode value for 62.5 µm fiber with a 3 dB reduction when 50 µm fiber is tested. The VIAVI documents say typical values were measured at 25 °C. The DMS reading is that if any one of the five items (pulse width, averaging time, noise criterion, wavelength and fiber type) differs between two documents, the two numbers are not compared on the same footing.
The noise criterion deserves a check in older documents. The search-result excerpt of a 1999 EDN article says the upper noise level can be taken as the value that contains 98% of the data points (the approach of IEC 61746) or as the RMS value, and that the RMS method gives the better figure. The full article could not be read and the text of IEC 61746 was not read. All current documents read here use RMS (SNR=1), so the difference is a point to check when comparing older datasheets or datasheets from other manufacturers.
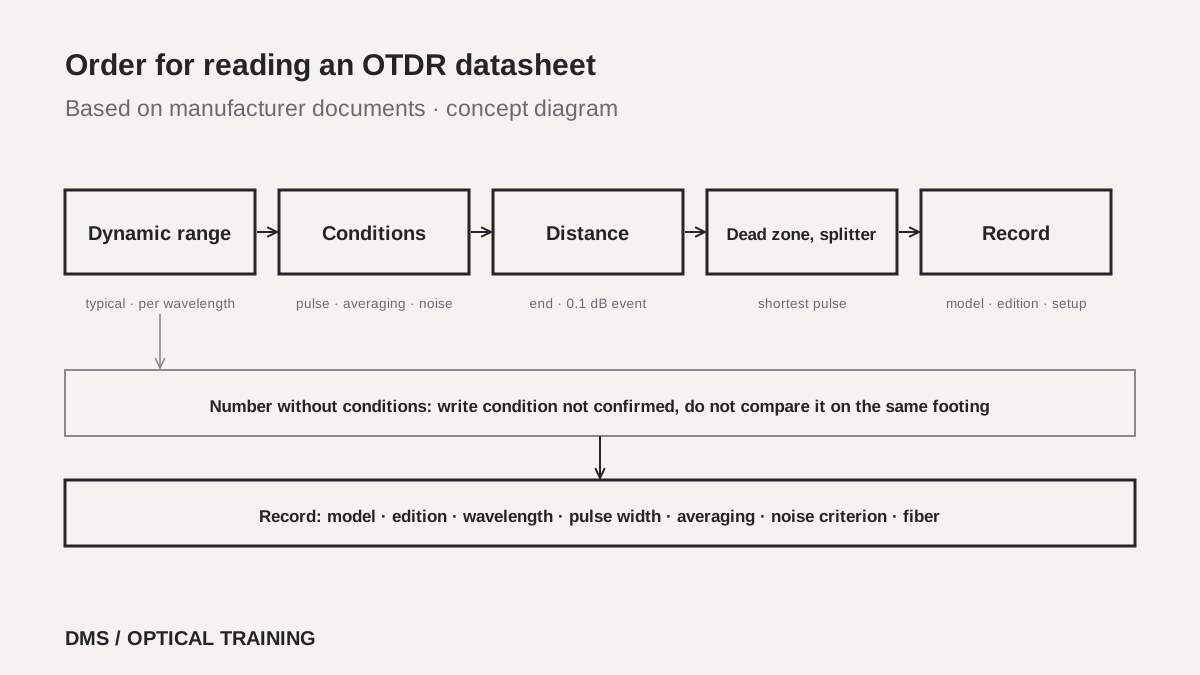 Order for reading an OTDR datasheetView original
Scroll horizontally to view a wide table.
| Document and edition | Dynamic range values | Stated conditions | Nature of the value |
|---|---|---|---|
| Fluke OptiFiber Pro (search listing date 2021-07-08, no revision mark inside) | Single-mode 1310 nm 32 dB, 1550 nm 30 dB · multimode 850 nm 28 dB, 1300 nm 30 dB · HDR 1310 nm 42 dB, 1550 nm 41 dB | SNR=1, 3 minute averaging, widest pulse width (HDR adds 100 km fiber) | Typical |
| VIAVI SmartOTDR 100A/B (reseller copy, search listing date 2022-12-19) | 100AS 30/30 dB · 100A 37/35/32 dB · 100B 40/40/41/41 dB | One-way difference between extrapolated backscatter and RMS (SNR=1) noise, 3 minute averaging, widest pulse width | Typical, 25 °C |
| VIAVI OTDR user manual, 4100 modules (700MAN201 Rev. 011, marked 2025-11-25) | Multimode 26/24 dB · single-mode A 37/36/36, B 42/40/41/41, C 45/44/44/42 dB | 3 minute averaging, largest pulse width, RMS noise | Typical, 25 °C |
| Corning OV-1000 (LAN-748-EN, 2006-07) | 400-SD37 1310/1550 nm 38/37 dB at 10 µs, 39/38 dB at 20 µs · multimode 27/26 dB | SNR=1, 3 minute averaging · multimode for 62.5 µm | Typical |
| EXFO Application Note 194 (2017-03) | No figures, explanatory document | Usually longest pulse width, 3 minute averaging, SNR=1 | Explains how to read |
-
Read dynamic range together with pulse width, averaging time, noise criterion, wavelength and fiber type
-
Every document that gave a value called it typical, and none called it guaranteed
-
Check in older documents whether the noise criterion is the 98% method or the RMS method
Can the instrument measure as far as its dynamic range suggests?
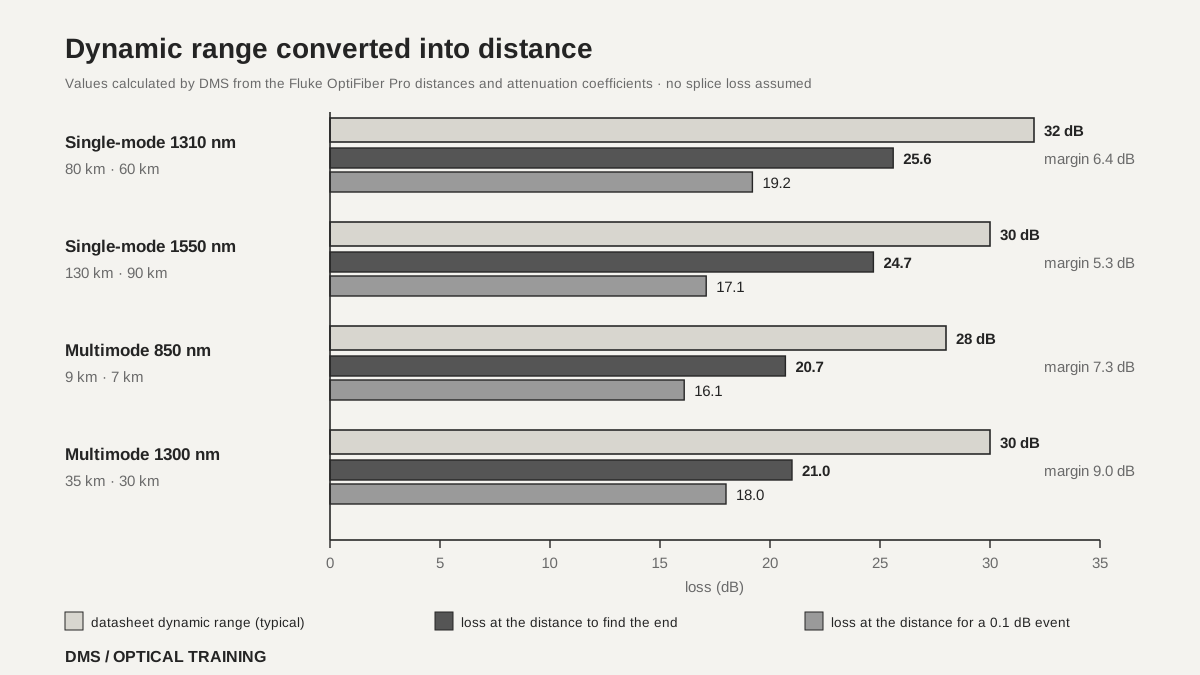
No. The Fluke document gives dynamic range and measurable distance separately for the same instrument, and splits the distance again into finding the fiber end and measuring a 0.1 dB event. The single-mode module finds the end at 80 km or measures a 0.1 dB event at 60 km at 1310 nm, with a note that attenuation before the event is at most 20 dB. At 1550 nm the distances are 130 km and 90 km with at most 18 dB. The same document gives fiber attenuation coefficients of 0.32 dB/km at 1310 nm and 0.19 dB/km at 1550 nm, so multiplying distance by the coefficient shows how much loss was used.
This calculation is DMS multiplying two numbers from the document. At 1310 nm, 80 km times 0.32 dB/km is 25.6 dB, 60 km gives 19.2 dB, and subtracting 25.6 dB from 32 dB leaves 6.4 dB. At 1550 nm, 130 km times 0.19 dB/km is 24.7 dB, 90 km gives 17.1 dB, and 5.3 dB is left. The document does not say it converted the figures this way, and the values assume no splice or connector loss. Still, a remaining margin of 5 to 7 dB or so is not far from the selection guideline EXFO gives.
The EXFO application note offers a rule of thumb that OTDR dynamic range should be 5 to 8 dB larger than the largest loss that will be met. As its example, a single-mode dynamic range of 35 dB has a usable value of about 30 dB, and assuming 0.20 dB/km at 1550 nm with a 0.1 dB splice every 2 km, it calculates certifying distances up to about 120 km. That 120 km is the same as dividing 30 dB by 0.25 dB/km, because each 2 km uses 0.4 dB of fiber and 0.1 dB of splice.
The DMS reading is that when you turn dynamic range into fiber length, first subtract splice, splitter and connector losses and not only fiber attenuation, and when the goal is to measure event loss, base the distance on a figure shorter than the distance to find the end. Multimode values change with the fiber. The Corning document says dynamic range stated for 62.5 µm fiber is reduced by 3 dB on 50 µm fiber.
Scroll horizontally to view a wide table.
| Wavelength and dynamic range (Fluke OptiFiber Pro) | Distance to find the end | Distance to measure a 0.1 dB event | Loss converted with fiber attenuation (DMS calculation) |
|---|---|---|---|
| Single-mode 1310 nm · 32 dB | 80 km | 60 km (at most 20 dB before the event) | 25.6 dB, 19.2 dB (0.32 dB/km) |
| Single-mode 1550 nm · 30 dB | 130 km | 90 km (at most 18 dB before the event) | 24.7 dB, 17.1 dB (0.19 dB/km) |
| Multimode 850 nm · 28 dB | 9 km | 7 km (at most 18 dB before the event) | 20.7 dB, 16.1 dB (2.3 dB/km) |
| Multimode 1300 nm · 30 dB | 35 km | 30 km (at most 18 dB before the event) | 21.0 dB, 18.0 dB (0.6 dB/km) |
-
A datasheet can state dynamic range and measurable distance separately
-
Distance to find the end and distance to measure a 0.1 dB event differ even on the same instrument
-
Choose a dynamic range 5 to 8 dB larger than the largest loss you will meet
Does a larger dynamic range also mean a better dead zone?
Read them separately. Dynamic range is stated at the widest pulse width and dead zone at the shortest, so one measurement setting does not give both numbers at once. EXFO explains that dead zones lengthen as the pulse width increases and that specifications use the shortest pulse width. It also writes that a high dynamic range stated at 20 µs does not guarantee a high dynamic range at short pulses, and that excessive trace filtering could artificially boost dynamic range. The FOA page also says longer pulses give less noise and longer distance but reduce the ability to resolve events, and that the test pulse overloads the receiver and hides events nearby.
In the tables read here, dead zones were longer as dynamic range grew within the same product family. The Corning 1310 nm values were 35 dB with an event dead zone of 1 m and an attenuation dead zone of 4.5 m for the 400-SD34, 38 dB with 1 m and 5 m for the 400-SD37, and 40 dB with 3 m and 10 m for the 400-SD40. The VIAVI SmartOTDR 100B, however, has a 1310 nm dynamic range of 40 dB, larger than the 37 dB of the 100A, and an event dead zone of 0.9 m, shorter than the 1.35 m of the 100A. The Fluke high dynamic range module has 42 dB with 0.7 m and 4 m at 1310 nm, against 32 dB, 0.6 m and 3.6 m for the standard single-mode module. So do not estimate one number from the other. Read both.
The measurement conditions for dead zones also differ a little between documents. VIAVI measures the event dead zone at 1.5 dB below the peak of a reflective event and the attenuation dead zone at 0.5 dB off a linear regression, both at the shortest pulse width. Corning states single-mode reflectance below -45 dB with a 5 ns or 10 ns pulse, and Fluke states a reflection peak below -50 dB for single-mode. EXFO describes the same issue by noting that a -55 dB reflection gives a shorter stated dead zone than -45 dB. Dead zones themselves are covered in the earlier OTDR dead zone and pulse width lesson, so this lesson only shows how to read them as a pair with the dynamic range line.
 Dynamic range converted into distanceView original
Scroll horizontally to view a wide table.
| Document and model (1310 nm) | Dynamic range | Event dead zone · attenuation dead zone | Conditions for the dead zone |
|---|---|---|---|
| Corning OV-1000 400-SD34 (2006) | 35 dB | 1 m · 4.5 m | Reflectance below -45 dB, 5 ns pulse |
| Corning OV-1000 400-SD37 (2006) | 38 dB | 1 m · 5 m | Reflectance below -45 dB, 5 ns pulse |
| Corning OV-1000 400-SD40 (2006) | 40 dB | 3 m · 10 m | Reflectance below -45 dB, 10 ns pulse |
| Fluke OptiFiber Pro single-mode | 32 dB | 0.6 m · 3.6 m | Shortest pulse width, reflection peak below -50 dB |
| Fluke OptiFiber Pro HDR | 42 dB | 0.7 m · 4 m | Shortest pulse width, reflection peak at -50 dB |
| VIAVI SmartOTDR 100A | 37 dB | 1.35 m · 4 m | Shortest pulse width, FC/UPC-type reflectance |
| VIAVI SmartOTDR 100B | 40 dB | 0.9 m · 2.5 m | Shortest pulse width, FC/UPC-type reflectance |
-
Dynamic range is stated at the widest pulse width and dead zone at the shortest
-
Within the same product family read here a larger dynamic range came with longer dead zones, but not every instrument follows that
-
Dead zone reflectance and the measuring point differ between documents
How much dynamic range does a PON link need?
A link through a splitter is, according to the FOA document, viewed up to a loss limit of about 28 dB, so with too little dynamic range the end is not found or the loss of far events cannot be trusted. The FOA FTTH testing page gives the working loss range at the subscriber for a 32-way GPON as about 13 to 28 dB, and the splitter loss for a total split of 32 as about 18 dB. It says the OTDR must expect about 18 dB plus fiber up to the 28 dB limit, which equals nearly 50 km of fiber alone.
As a DMS reading, adding EXFO's 5 to 8 dB rule of thumb to 28 dB gives a required dynamic range of 33 to 36 dB. The 32 dB and 30 dB of the standard Fluke single-mode module read here may fall short by this calculation, and the 42 dB and 41 dB of the high dynamic range module exceed it. This comparison is DMS combining two documents and is not a manufacturer statement that the instrument suits PON testing.
The FOA page writes that this application carries conflicting requirements, high dynamic range and high resolution. Using a long pulse to gain distance loses the resolution needed on a short PON link, so the page suggests more averages and a design with connector test points around the splitters so that segments can be measured individually. The manufacturer documents gave a separate attenuation dead zone after a splitter. The Fluke HDR module states 30 m after a 1:16 non-reflective splitter with a 50 ns pulse and 3 cm sampling. The VIAVI SmartOTDR 100A states 40 m after 12 dB of splitter loss and the 100B states 45 m after 15 dB, both at 300 ns. In the VIAVI manual the B module is 45 m (200 ns) and the C module 20 m (100 ns) on a 16 dB loss, 1x32 non-reflective splitter. Because splitter loss and pulse width all differ, do not rank these four numbers. Start by checking whether the condition matches the split ratio and pulse width of your link.
-
FOA states the working loss at the subscriber of a 32-way GPON as about 13 to 28 dB
-
28 dB plus 5 to 8 dB gives 33 to 36 dB as the dynamic range needed in the DMS calculation
-
Compare the dead zone after a splitter only between the same splitter loss and pulse width
How do you read this in a hypothetical case?
The situations below are assumed for teaching and are not real sites or measurements. The first case is two quotations. Instrument A's datasheet states 35 dB of dynamic range with SNR=1, 3 minute averaging and the widest pulse width, while instrument B shows only 35 dB with no conditions. The two numbers cannot go on the same line. First look in B's datasheet footnotes and the manufacturer's public documents for the pulse width, averaging time and noise criterion, and if they cannot be found, write condition not confirmed in the comparison table.
The second case is a 32-way PON check with a 28 dB loss limit. Say the candidate instrument has a typical single-mode dynamic range of 32 dB. Even adding only EXFO's 5 dB to 28 dB gives 33 dB, so this instrument may be too small to test the far part of this link. Before buying, check three things. First, the dynamic range and conditions at the wavelength you will use. Second, whether test point design lets you measure in front of the splitter and the segments behind it separately. Third, whether the test time is acceptable if the averaging time is increased. All numbers in this case are assumptions.
-
A dynamic range without conditions goes into the comparison table as condition not confirmed
-
A typical 32 dB may be too little margin for a link with a 28 dB limit
-
Before changing the instrument, look at test point design and averaging time
What goes into an instrument selection and a test record?
In the selection table, put the model and module, the document number and edition, and the dynamic range on one line together with the wavelength, pulse width, averaging time, noise criterion and fiber type. If the datasheet gives a distance to find the end and a distance to measure a 0.1 dB event, copy them separately, and write the dead zone and the dead zone after a splitter with the reflectance, pulse width and splitter loss on the same line. Keep the date printed in the document apart from the date in a search listing. The Fluke and VIAVI SmartOTDR datasheets read here showed no revision mark inside, and the Corning document is a 2006 edition, so it was not assumed to hold current values for a product on sale.
In the test record, write the measurement settings separately from the datasheet. Keep the wavelength, pulse width, averaging time, distance range, resolution, fiber type, and launch and receive cables, and record as they are any section where the end was not found or the trace was noisy. The FOA documents say more averages reduce noise and a long pulse extends distance at the cost of resolution. If the test used an automatic mode, write down the pulse width and averaging time the instrument chose.
This lesson is limited to five manufacturer documents (Fluke, two from VIAVI, EXFO and Corning) and two FOA documents. The text of the standard definition for dynamic range (IEC 61746) and the full EDN article were not read. Every value is typical, so individual units can vary, and the values for models now on sale, the dynamic range measured on a real instrument and acceptance criteria were not confirmed.
-
Write dynamic range on the same line as pulse width, averaging time, noise criterion, wavelength and fiber type
-
Copy the distance to find the end, the distance to measure an event and the dead zones separately
-
Do not leave a missing condition blank, write that it was not confirmed
Checklist
-
Did you find the pulse width, averaging time, noise criterion, wavelength and fiber type next to the dynamic range on the OTDR datasheet you use?
-
Did you convert dynamic range into distance after subtracting splice, splitter and connector losses and not only fiber attenuation?
-
Did you calculate whether the dynamic range is 5 to 8 dB larger than the largest loss you will meet?
-
Did you check at which reflectance, pulse width and splitter loss the dead zone and the dead zone after a splitter were stated?
-
Did you write the actual measurement settings and the datasheet edition in the test record?
Review questions
1. If two OTDR datasheets both state 35 dB of dynamic range, is the performance the same?
Answer and explanation: You cannot tell. Even with the same value, if the pulse width, averaging time, noise criterion (RMS or 98% method), wavelength or fiber type differs, the two cannot be compared on the same footing. Keep the one with no stated conditions in the comparison table as condition not confirmed.
2. A Fluke single-mode module gives 32 dB of dynamic range at 1310 nm, 80 km to find the end and 0.32 dB/km attenuation. How much loss does finding the end use, and how much margin is left?
Answer and explanation: 80 km times 0.32 dB/km is 25.6 dB, and subtracting it from 32 dB leaves 6.4 dB. This is DMS multiplying two numbers from the document and assumes no splice or connector loss.
3. What dynamic range is needed for a PON link with a 28 dB loss limit when EXFO's rule of thumb is applied?
Answer and explanation: 28 dB plus 5 to 8 dB gives 33 to 36 dB. This is DMS combining the FOA 28 dB limit with the EXFO rule of thumb, and in a real selection you also confirm the value at the wavelength you will use together with the pulse width and averaging time conditions.
Sources
-
Fluke Networks: OptiFiber Pro Series OTDRs · search listing date 2021-07-08, no revision mark inside, specifications and notes on pages 25 to 28
-
VIAVI: SmartOTDR 100A/B Series Data Sheet (reseller copy) · search listing date 2022-12-19, specifications and notes on page 3
-
VIAVI: OTDR User Manual 4100 Series modules and SmartOTDR · 700MAN201 Rev. 011, marked 2025-11-25, pages 97 to 98 (PDF pages 113 to 114), page 98 rendered and checked
-
EXFO: Application Note 194, Fundamentals of an OTDR · APNOTE194.2AN, 2017-03, pages 1 to 4
-
Corning Cable Systems: OV-1000 OTDR Product Specifications · LAN-748-EN, 2006-07, pages 2 to 4 (current availability not confirmed)
-
FOA: Testing Fiber To The Home · no date shown, the PON testing section
-
FOA: Optical Time Domain Reflectometer (OTDR) · no date shown, the pulse width and averaging sections
-
EDN: Key OTDR Specification Relates to User's Real Needs · 1999-12-01, search-result excerpt only (full page could not be read)