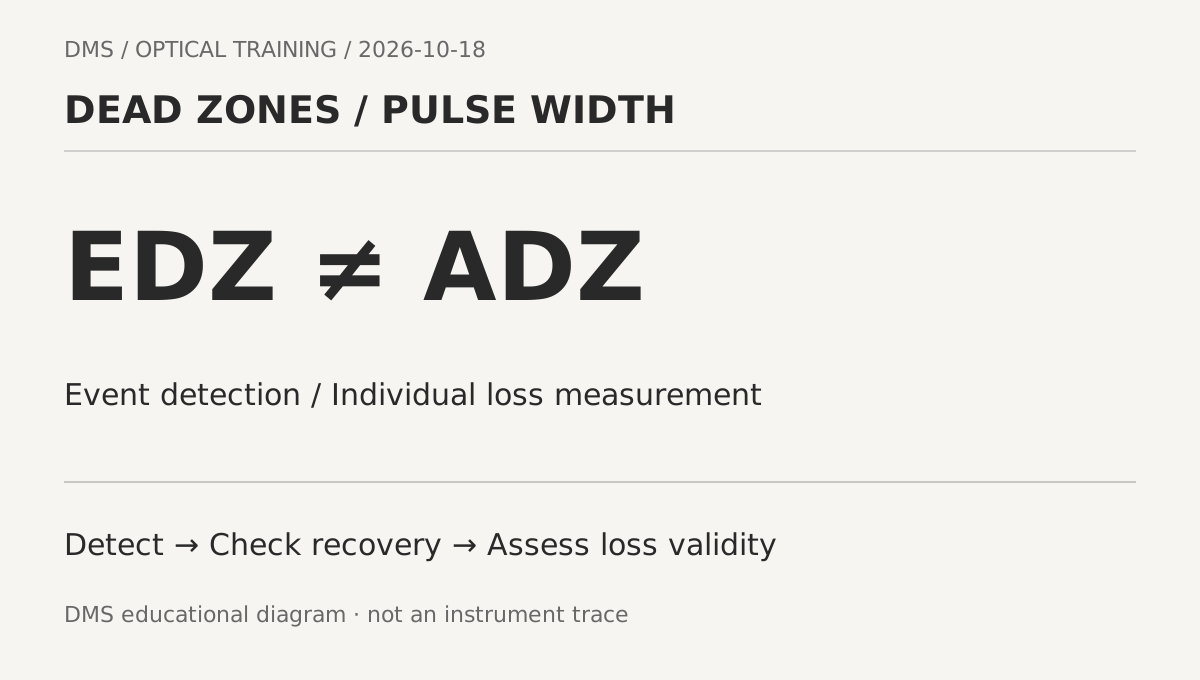
Seeing two nearby connector events on an OTDR trace does not prove that their individual losses can be measured. Distinguish the event dead zone from the attenuation dead zone, then check pulse width, reflectance and backscatter recovery. An unsupported loss value must not become zero or a pass.
Based on official manufacturer material checked on October 18, 2026. See the sources for document versions and limits.
Learning goals
-
Separate event detection from individual loss measurement.
-
Compare specification conditions with the acquisition settings.
-
Hand over short-pulse and full-span records together.
Do two peaks validate two loss values?
 Do two peaks validate two loss values?View original
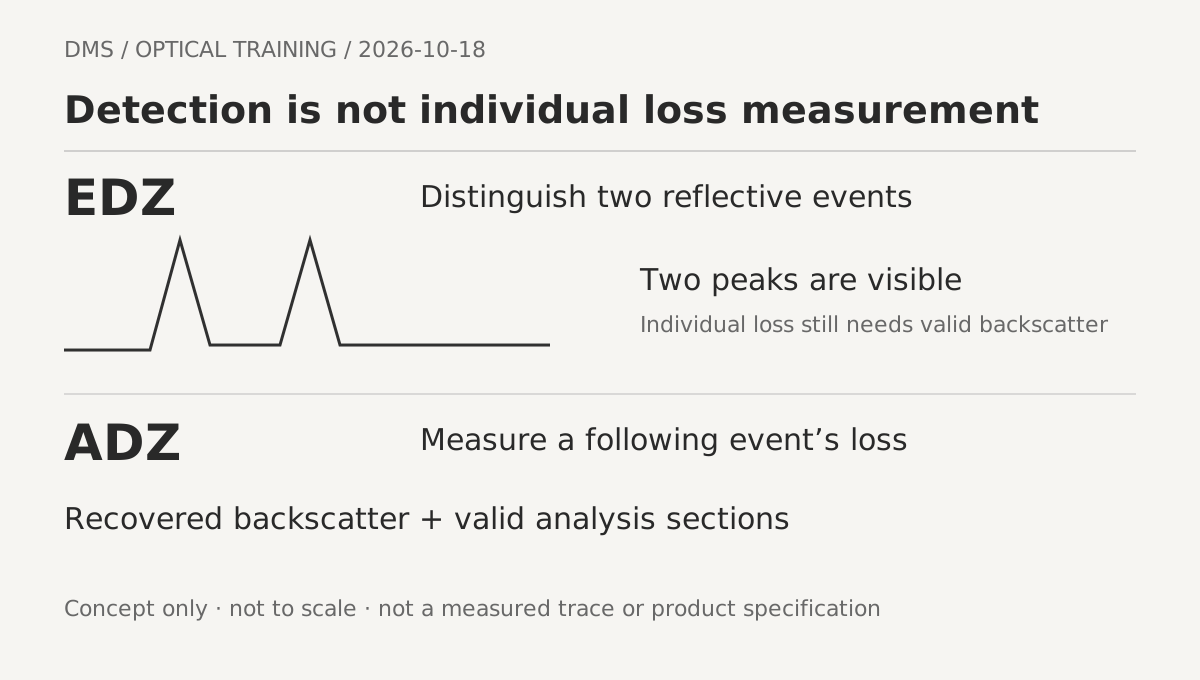
No. The event dead zone (EDZ) describes the ability to distinguish nearby reflective events. The attenuation dead zone (ADZ) describes recovery after a reflection so that the loss of a following event can be measured. This lesson reviews saved OTDR traces from inactive fibers authorized for testing. It is not a procedure for injecting test light into a live network.
Page 3 of the VIAVI white paper defines EDZ as the minimum distance at which two consecutive reflective events can be distinguished, and ADZ as the minimum distance after a reflective event at which a non-reflective event can be measured. EXFO's glossary also separates detection from accurate measurement of a following event's loss. Two numbered rows in an event table therefore do not validate two independent loss values.
Loss analysis needs usable backscatter on both sides of the event. Peaks may be distinguishable while the trace after the first reflection has not recovered enough for independent loss analysis. Software may report a group loss instead. Identify the group and its limits in the report. Dividing its total loss by the number of connections does not create measurements of the individual connections.
-
EDZ: distinguish reflective events
-
ADZ: measure a following event's loss
-
Two peaks do not validate individual losses
Conditions behind the specification
A dead-zone specification is not a fixed ruler that applies everywhere on a link. Vendors state performance under particular pulse-width, wavelength and reflection conditions. Fluke Networks' OptiFiber Pro explanation stresses the difference between specification footnotes and a real network. Obtain the instrument model and the relevant document version before copying a distance into a test plan.
EXFO explains that stronger reflections can delay detector recovery, and that dead zones extend as pulse width increases. A reflectance of −45 dB represents a stronger reflection than −55 dB. These two numbers illustrate the source's comparison of reflection conditions. They are neither a universal connector acceptance limit nor a formula for calculating the dead-zone length in an installed link.
Fluke cautions against treating a specification obtained at one good, low-reflectance connection as a guarantee for several closely spaced connections in a network. Saturation, the reflection tail, wavelength and analysis method can affect what is reported. When comparing instruments, align the stated test conditions before ranking the smallest distance. Similar headline values do not establish equivalent performance under a different reflective load.
-
Check model, document, wavelength and pulse width
-
Compare reflection conditions with the actual trace
-
A specification is not a network measurement guarantee
Pulse width and reach
 Pulse width and reachView original
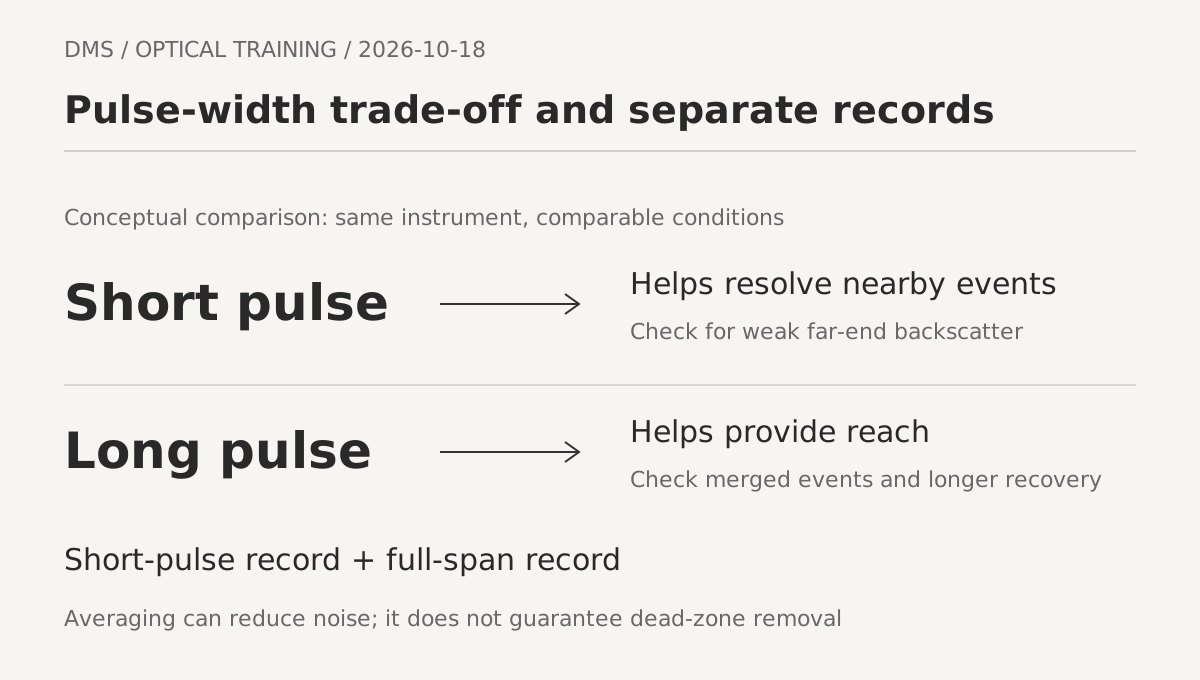
For the same instrument under comparable conditions, a short pulse helps separate nearby events but carries less energy. On a long or high-loss path, the distant backscatter may fall into noise. A longer pulse supplies more energy to examine the distant span, but nearby events can merge and recovery after a reflection can occupy a longer section of the trace.
EXFO describes increasing acquisition time to improve the signal-to-noise ratio of a noisy short-pulse trace. Averaging has limits; it does not improve the signal indefinitely. It can reduce noise, but it does not automatically separate events merged by pulse width and receiver recovery. Zooming the display also does not increase the physical resolving capability of data that have already been acquired.
Keep a short-pulse record for closely spaced events and another record that establishes the full span. If pulse width changes, confirm the fiber and direction and retain wavelength, distance range and averaging time for each file. Use an instrument's automatic multi-pulse analysis according to its documentation. This lesson does not recommend manually stitching captures together and presenting the result as one validated loss table.
-
Short pulse: helps resolve nearby events
-
Long pulse: helps provide reach
-
More averaging does not remove a dead zone
A hypothetical 2 m connection interval
Assume two connector connections are 2 m apart in a fictional training link. The fictional instrument's specification states an EDZ of 1 m and an ADZ of 4 m. These values are invented solely for the exercise; they are not a product specification or measured field result. The comparison 2 m greater than 1 m does not establish that both connection losses can be measured independently.
In the exercise, the 2 m interval is shorter than the stated 4 m ADZ, so independent loss validity needs scrutiny. Potentially seeing two peaks is different from having enough recovered backscatter for loss analysis. Conversely, an interval longer than a specified ADZ does not automatically pass. Different reflection and acquisition conditions can change the result; inspect recovery and the actual fitting sections on the raw trace.
If the software reports the connections as one loss group, retain that identification and hold judgement on individual losses. An additional short-pulse capture or an authorized reverse-direction measurement may provide more information, but success is not guaranteed. Strong reflections and close spacing may remain problematic from the other end. Do not combine rows from opposite directions without first matching their physical events.
-
Hypothetical: interval 2 m / EDZ 1 m / ADZ 4 m
-
Separate peak detection from loss validity
-
Do not divide a group loss between connections
Remeasurement and review holds
Start by matching the expected number and order of connections in the drawing to the trace. Fewer detected events do not prove that a planned connection is absent. Confirm cable, fiber and direction, and relate optical distance to surrounding connections. Check usable backscatter and recovery after reflections before reading a loss as an independent result.
Only personnel who have verified network and instrument safety conditions should perform a new acquisition. For merged nearby events, consider an available shorter pulse and adequate acquisition time if the signal is weak. Obtain a separate full-span record if the far end cannot be established. Suitable launch and receive fibers support end-connection measurement; they do not increase the spacing between two connections in the middle of the link.
A blank loss field, hidden event or merged group must not be rewritten as 0 dB. Record precisely which evidence is missing for detection or measurement. If the event count changes after another acquisition, compare analysis settings and raw files and preserve the earlier record. This sequence is a DMS teaching framework, not a replacement for a standard's acceptance procedure or a manufacturer's operating instructions.
-
Match events, check recovery, then assess loss validity
-
Retain close-event and full-span acquisitions
-
Do not replace blank or hidden results with zero
Handover and verification limits
Record instrument model and software, specification document version, wavelength, pulse width, averaging time, range, fiber settings and direction. Include the expected spacing of nearby connections and the evidence used to match them. Retain the raw trace with the automatic analysis rather than a screenshot alone, so the next reviewer can revisit the measured scope and the reasons for a hold.
The reviewed sources explain general principles and interpretation of manufacturer specifications. The VIAVI white paper carries a 2020 copyright notice. The Fluke web explanation is dated May 1, 2015. No publication date or version is displayed for the EXFO glossary. These explanations do not verify the interface of current software or establish the requirements of a current standard.
No instrument reproduction test, current standard text or customer-specific acceptance limit was verified for this lesson. The learning outcome is to distinguish EDZ from ADZ and separate valid individual loss measurements from unresolved ones. A passing end-to-end loss result does not by itself approve each hidden connection. Final acceptance requires the applicable specification and valid test evidence, assessed separately from this educational review.
-
Hand over raw traces, settings and specification conditions
-
Distinguish individual and grouped measurements
-
Verify current standards, equipment and acceptance limits separately
Handover checklist
-
Have EDZ and ADZ been distinguished?
-
Were specified pulse and reflection conditions compared with actual settings?
-
Was usable backscatter checked around each individual loss?
-
Were merged, hidden and blank results kept distinct from zero or pass?
-
Were short-pulse and full-span raw records retained together?
Review questions and answers
1. Do two visible peaks validate the individual connection losses?
Answer: No. Event detection and loss measurement are different. Check recovered backscatter and the analysis sections.
2. In the exercise, 2 m exceeds the 1 m EDZ but is shorter than the 4 m ADZ. What remains on hold?
Answer: Independent loss judgement for each connection. The numbers are hypothetical; actual conditions and the trace still require review.
3. Does longer averaging necessarily resolve events merged by a long pulse?
Answer: No. Averaging helps with noise but does not eliminate a dead zone. Add suitable short-pulse and full-span records.
Sources and versions
-
VIAVI: Choosing the Right Optical Time Domain Reflectometer (OTDR) · ©2020, document code otdr-wp-tfs-nse-ae 30175828 902 0319
-
EXFO: Optical Time-Domain Reflectometer (OTDR) Glossary · Web, no date or version displayed
-
Fluke Networks: Attenuation and OTDR Event Dead Zones Explained – OptiFiber Pro · Web, dated 2015-05-01