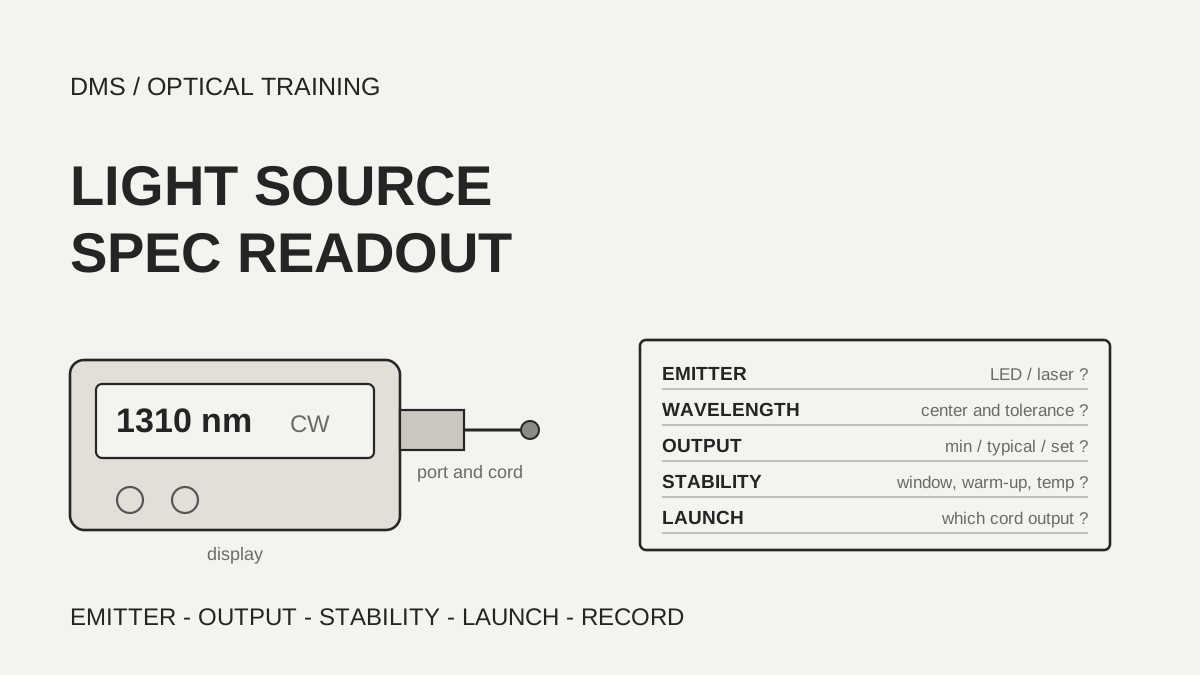
The stability figure on an OLTS (optical loss test set) light source datasheet is read together with the time window and the warm-up it was stated for, not only as the width of the output change. In the documents reviewed, the same ±0.1 dB was a value over 8 hours after a 5 minute warm-up in one place and a value over 8 hours after a 15 minute warm-up in another, and the multimode launch condition (the mode distribution with which a source fills the fiber) was stated at the output of a specified test reference cord, not for the source alone. A test record therefore carries each source value and its conditions on the same line.
Documents checked on November 3, 2026: the manufacturer and organization documents listed under Sources.
Learning objectives
-
Find the emitter, center wavelength and tolerance, spectral width and connector interface on a light source datasheet, and check that they suit the fiber and the power meter in use.
-
Read the time window, warm-up and temperature behind a stability figure, and calculate in dB the change that can occur between setting the reference and measuring.
-
Check which cord the multimode launch condition was stated at, turn the findings into a checklist and carry them into the test record.
What do you read first on a light source datasheet?
Read four boxes first: emitter type, center wavelength and tolerance, spectral width and connector interface. In the documents reviewed, the multimode sources were LEDs (light emitting diodes) at 850 nm and 1300 nm, and the single-mode sources were Fabry-Perot laser diodes at 1310 nm and 1550 nm. The FOA pages also describe LEDs as the usual source for multimode fiber and lasers as the usual source for single-mode fiber.
The same wavelength name carries different tolerances. The two VIAVI documents state ±20 nm at all four wavelengths. AFL states ±30 nm at 850 nm, +30/-20 nm at 1300 nm and ±20 nm at 1310 and 1550 nm. The Fluke CertiFiber Pro states ±30 nm at 850 nm, ±20 nm at 1300 nm, ±20 nm at 1310 nm and ±30 nm at 1550 nm. As a DMS interpretation, a wider tolerance leaves more room for the actual source wavelength to sit away from the calibrated wavelength of the power meter. The FOA page shows the OM4 attenuation difference across the allowed 850 nm variation as 0.6 dB/km and gives the worst-case error on a 100 m link as 0.06 dB.
Spectral width is read together with its definition. The notes of the Fluke CertiFiber Max say the width is RMS for Fabry-Perot lasers and FWHM (full width at half maximum) for LEDs, and the VIAVI MPOLx states FWHM. The AFL and VIAVI OLTS-85/85P tables show no definition, and the pages of the Fluke CertiFiber Pro that were read have no such box. A figure of 5 nm is therefore not compared across documents whose definitions differ.
The connector interface is also a datasheet line. AFL states that every model has a UPC optical port and that test jumpers and connector adapters are bought separately. The VIAVI OLTS-85 uses an interchangeable FC/PC adapter on the multimode side and SC/PC on the single-mode side, and the MPOLx uses a pinned MPO-12 interface with an APC end face for single-mode. The FOA page says source connectors are almost always fixed, so hybrid test jumpers with the source connector on one end and the connector under test on the other are used. As a DMS interpretation, find the polish of the source port (PC, UPC or APC) and the adapter in the datasheet and check that the end face of the cord in use matches.
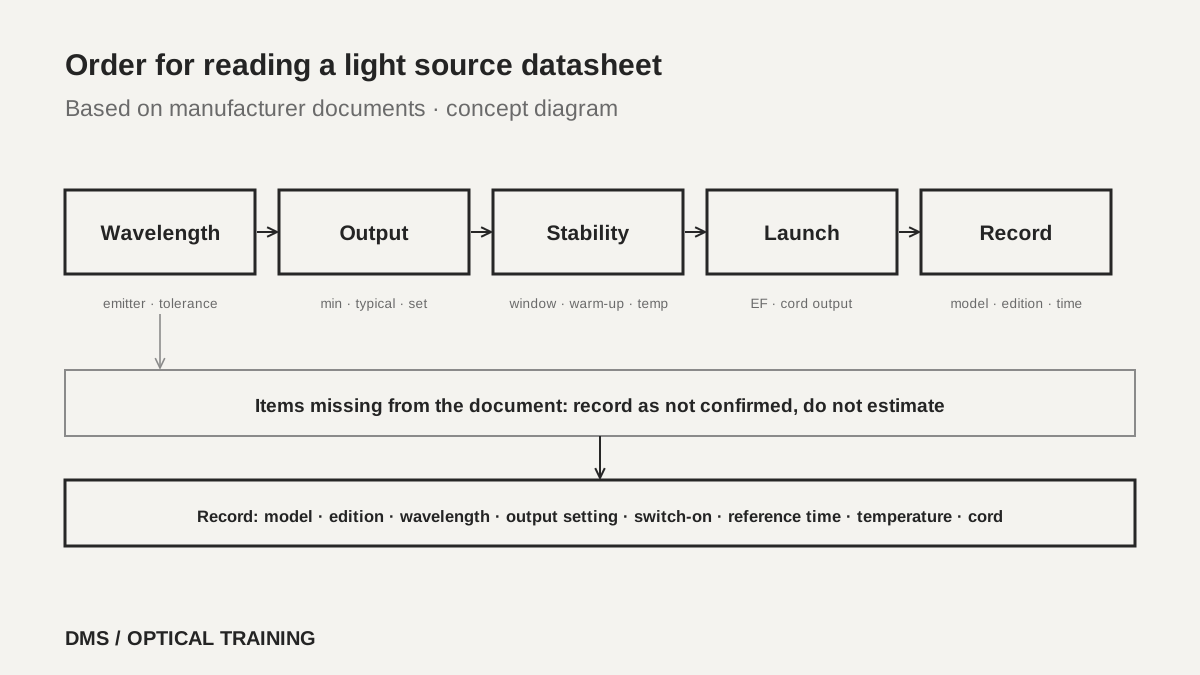 Order for reading a light source datasheetView original
Scroll horizontally to view a wide table.
| Document and edition | Emitter and wavelengths | Spectral width | Interface |
|---|---|---|---|
| AFL OLS1 and OLS2-Dual (OLS0-00-2000 Rev AC, 2022-03-27) | LED 850 ±30, 1300 +30/-20 · laser 1310, 1550 ±20 | 45 typ, 60 max / 120 typ, 170 max · 5 max | UPC port, swappable adapters |
| VIAVI OLTS-85/85P (30179546 004 0226) | LED 850, 1300 ±20 · Fabry-Perot 1310, 1550 ±20 | 50/170 · 5/5 (definition not shown) | FC/PC multimode, SC/PC single-mode |
| VIAVI MPOLx (30186091 906 0226) | LED 850, 1300 ±20 · Fabry-Perot 1310, 1550 ±20 | under 170 · under 5 (FWHM) | Pinned MPO-12, APC single-mode |
| Fluke CertiFiber Pro (Rev 2017-12-20) | LED 850 ±30, 1300 ±20 · laser 1310 ±20, 1550 ±30 | Not in the pages read | LC swappable adapter |
| Fluke CertiFiber Max (Revised 2026-01-14) | Single-mode Fabry-Perot 1310, 1550 ±20 | 5 or less (RMS for the laser) | Pinned MPO 16 |
-
Read emitter, wavelength and tolerance, spectral width and interface first
-
The same wavelength name carries a different tolerance in each document
-
Read a spectral width figure together with its definition
What conditions sit behind an output power figure?
Separate whether the output figure is a minimum, a typical value or a setting. AFL states multimode output as greater than -20 dBm with a 62.5 µm multimode jumper, notes that it is about 3 dB lower with a 50 µm mandrel-wrapped jumper, and states single-mode as 0 dBm adjustable by 2 dB. The Fluke CertiFiber Pro states -24 dBm or more for multimode with the EF cord and -4 dBm or more for single-mode. The VIAVI OLTS-85/85P settable output is in 0.1 dB steps, -22 to -25 dBm for multimode and 0 to -3 dBm for single-mode. The VIAVI MPOLx lists -26 dBm and -6 dBm, and its note calls this the typical output. The Fluke CertiFiber Max lists -12 dBm or more as the nominal value per module.
The same -24 dBm is used in the budget differently depending on whether it is a minimum or a typical value. The figure is the level leaving the source, and the level at the far end of the link is that value minus the link loss. For example, the typical multimode output of -26 dBm in the VIAVI MPOLx document and the -50 dBm lower end of its power meter range leave 24 dB. DMS subtracted the two numbers, and the power meter uncertainty grows near the lower end of its range, which has to be read alongside.
A source with adjustable output needs its reference set again at the new level. The FOA page lists proper setting of the reference power among the process-induced errors. As a DMS interpretation, if the output setting was changed, record the level and the time of the change and do not carry over the reference set earlier.
Scroll horizontally to view a wide table.
| Document | Multimode output | Single-mode output | Condition attached to the output |
|---|---|---|---|
| AFL OLS1 and OLS2-Dual | Greater than -20 dBm | 0 dBm | About 3 dB lower with a 50 µm jumper, 2 dB adjustment on single-mode |
| VIAVI OLTS-85/85P | -22 to -25 dBm | 0 to -3 dBm | Settable in 0.1 dB steps |
| VIAVI MPOLx | -26 dBm | -6 dBm | Typical output |
| Fluke CertiFiber Pro | -24 dBm or more | -4 dBm or more | Multimode at the output of the EF cord |
| Fluke CertiFiber Max | Not in the table read | -12 dBm or more | Nominal per module |
-
Minimum, typical and setting are different promises
-
Calculate the room between the output and the lower end of the power meter range
-
If the output setting changes, set the reference again and record it
Which time window is a ±0.1 dB stability figure stated for?
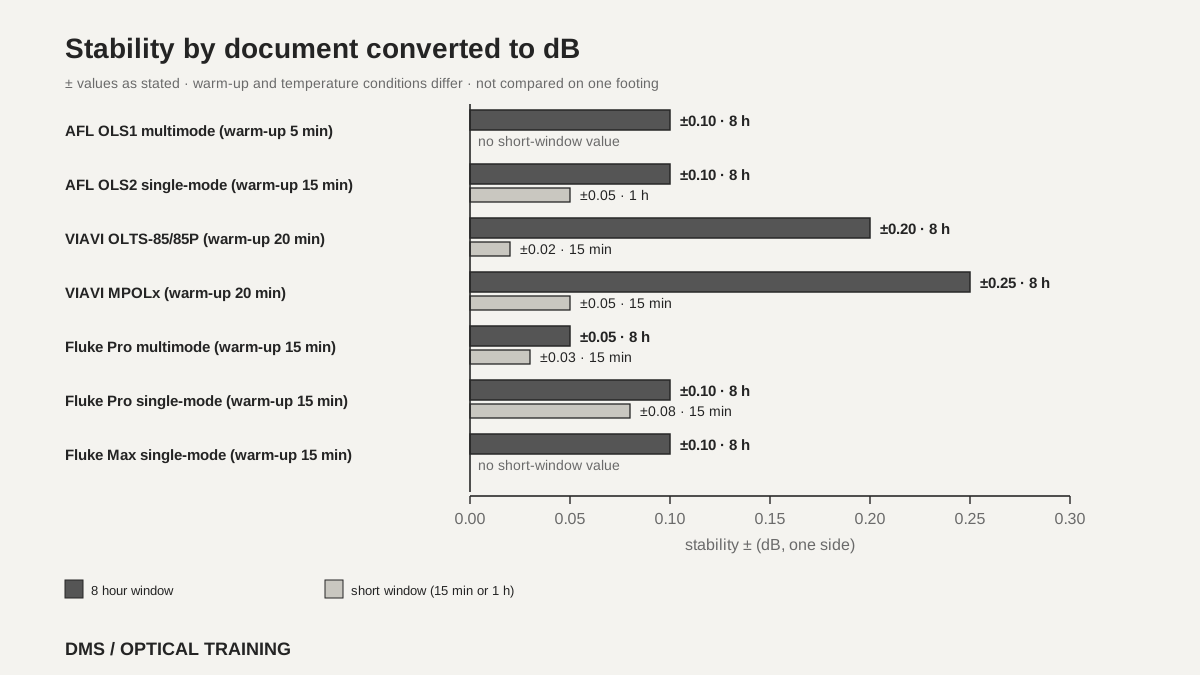
Stability is how much the output level changes over time, and each document states its own time window, warm-up and temperature. AFL states multimode as ±0.1 dB over 8 hours after a 5 minute warm-up, and single-mode as ±0.05 dB over 1 hour and ±0.1 dB over 8 hours after a 15 minute warm-up. The VIAVI OLTS-85/85P states ±0.02 dB over 15 minutes and ±0.2 dB over 8 hours, with a note for constant temperature after a 20 minute warm-up. The VIAVI MPOLx states ±0.05 dB over 15 minutes and ±0.25 dB over 8 hours, for a single channel, +5 to +45 °C, temperature change of ±0.3 K, after a 20 minute warm-up.
The Fluke CertiFiber Pro states ±0.03 dB over 15 minutes and ±0.05 dB over 8 hours for multimode, and ±0.08 dB over 15 minutes and ±0.1 dB over 8 hours for single-mode, relative to the level after a 15 minute warm-up at constant temperature. The column layout was confirmed on the rendered page. The Fluke CertiFiber Max has a single line of ±0.10 dB, and its note says relative to the level after a 15 minute warm-up at constant temperature, compliant for 8 hours. As the single-mode 15 minute figure of ±0.08 dB sitting close to the 8 hour figure of ±0.1 dB shows, do not assume a shorter window means a smaller number; read the figure the document prints.
A ± figure is one side of the width, so if the reference setting and the measurement sit at opposite ends, the difference from the source alone can reach twice the figure. The ±0.25 dB of the VIAVI MPOLx allows up to 0.5 dB between two moments, and the 8 hour ±0.1 dB of the Fluke allows up to 0.2 dB. DMS added the specification values for this worst case, and the real distribution is not known. The FOA page offers a direct check: connect a source to a meter with a cord, switch both on without warm-up and see how much the reading varies. It also says very accurate measurements may need optical feedback stabilization of the source.
As a DMS interpretation, set the reference only after the warm-up stated in the datasheet has passed, and check the reference again when the test runs longer than the stated window. A reference set before warm-up lies outside the interval the specification describes.
 Stability by document converted to dBView original
Scroll horizontally to view a wide table.
| Document | Short window | 8 hours | Warm-up and temperature |
|---|---|---|---|
| AFL OLS1 (multimode) | Not stated | ±0.1 dB | After 5 minutes |
| AFL OLS2 (single-mode) | 1 hour ±0.05 dB | ±0.1 dB | After 15 minutes |
| VIAVI OLTS-85/85P | 15 minutes ±0.02 dB | ±0.2 dB | After 20 minutes, constant temperature |
| VIAVI MPOLx | 15 minutes ±0.05 dB | ±0.25 dB | After 20 minutes, +5 to +45 °C |
| Fluke Pro multimode | 15 minutes ±0.03 dB | ±0.05 dB | After 15 minutes, constant temperature |
| Fluke Pro single-mode | 15 minutes ±0.08 dB | ±0.1 dB | After 15 minutes, constant temperature |
| Fluke Max single-mode | Not stated | ±0.10 dB | After 15 minutes, constant temperature |
-
Read stability with its window, warm-up and temperature
-
A ± figure is one side, so the difference between two moments can be twice as large
-
Set the reference after the warm-up
Which cord was the multimode launch condition stated at?
The launch condition is the mode distribution with which a source fills a multimode fiber, and EF (encircled flux) is the standard way of limiting the share of power contained within a given radius of the core. Among the documents read, the VIAVI OLTS-85/85P states compliance with TIA-526-14 and IEC 61280-4-1, the VIAVI MPOLx with TIA-526-14B and IEC 61280-4-1, and the Fluke CertiFiber Pro with TIA-526-14-B, ISO/IEC 14763-3 and IEC 61280-4-1. In all three, the note says the value is at the output of the EF-TRC (EF test reference cord) and that variations between EF measurement equipment may occur but EF compliance can be expected with a 95% confidence factor. VIAVI adds that this is valid for IEC 61280-4-1 at 850 nm.
EF compliance is therefore a value for the source and a specified cord together, not for the source alone. A note under the AFL table says a complementary encircled flux mode conditioner may be needed to meet EF launch conditions on multimode fiber, and that the OLS1 can test 50 or 62.5 µm fiber with the supplied mandrels. The single-mode source table of the Fluke CertiFiber Max shows not applicable for launch condition, while a note refers to measuring at 850 nm at the output of an EF-maintaining patch cord. The table read does not settle which module that line refers to. The same document says the tester tracks time since the reference was set and the count of tests for the cords, to keep them within the test process.
The FOA page says the international standards require an encircled flux metric but TIA-568 requires it only for OM3, OM4 and OM5 fiber and allows OM1 and OM2 to use the earlier method. It describes a mandrel wrap as an alternative. Measure the output of the reference cord on the source, wrap it on the mandrel and measure again. If the power drops by 0.2 to 0.6 dB, the source is essentially EF compliant and can be used without the mandrel; if it drops by more than 0.6 dB, leave the mandrel on; and if it drops by less than 0.2 dB, the mode fill is too low and the source should not be used. The mandrel diameters in that guidance are for five turns: for 50/125 µm fiber 22 mm with 3 mm jacketed cable and 25 mm with 900 micron buffered fiber, and for 62.5/125 µm fiber 17 mm to 20 mm. The FOA page carries a 2019 copyright line and some sentences are dated, so read the mandrel values as the table FOA says it took from TIA-568. The current standard text was not read.
As a DMS interpretation, replacing the EF cord with another cord removes the condition the datasheet promised, so record the cord model, the date its reference was set and its use count, and replace worn cords.
-
EF compliance is a value for the source and the named cord together
-
The standards and methods differ by multimode fiber grade
-
The mandrel wrap is an alternative described by the FOA, not a manufacturer guarantee
Where are modes, warm-up and the valid temperature stated?
Source modes are a line that works only when the power meter matches. The VIAVI OLTS-85/85P lists CW (continuous wave), tone, auto wavelength, multi-wavelength modes and 270 Hz, 1 kHz and 2 kHz tones, and the MPOLx lists CW only. AFL describes CW as continuous output with no encoding, lists tone outputs of 270, 330, 1000 and 2000 Hz, and says Wave ID sources cut test time when paired with AFL power meters that read it. If the power meter cannot read the mode the source sends, that function cannot be used.
The temperature where the specification holds is a different line from the operating temperature. AFL states an operating temperature of -10 to 50 °C but says all specifications are valid at 25 °C. The Fluke CertiFiber Max states -10 to +45 °C for operation and applies its specifications at 23 °C, and the VIAVI OLTS-85/85P lists -5 to +45 °C for operation and separately a constant temperature in its stability note. As a DMS interpretation, in an environment far from the specification temperature such as a winter site, do not apply the stability figure as printed, and record the site temperature and the warm-up time.
The calibration interval was in the power meter box, not the source box. The VIAVI OLTS-85/85P and the MPOLx state a recommended recalibration interval of 3 years, and the power meter module of the Fluke CertiFiber Pro and the CertiFiber Max state 1 year. A calibration interval for the source alone was not found in the documents read. The FOA page says the uncertainty of the instrument is generally much smaller than the uncertainty caused by the fiber optic components and the test setup.
-
The source mode must match a mode the power meter reads
-
Operating temperature and the temperature where the specification holds are different lines
-
The calibration interval was found in the power meter box and not in the source box
How is the datasheet read in a hypothetical case?
The situation below is assumed for training and is not a real site or measurement. The first case is a single-mode 1310 nm test. Assume the source specification is -4 dBm or more with stability of ±0.1 dB over 8 hours after a 15 minute warm-up (Fluke Pro type). The technician set the reference 3 minutes after switching the source on, and in the afternoon a check of the reference with the same cord reads 0.12 dB higher.
First look at the warm-up. The specification is relative to the level after a 15 minute warm-up, so a reference set at 3 minutes lies outside the interval it describes. Next, ±0.1 dB is one side, so a difference of up to 0.2 dB between two moments can still be within the specification. Even so, the warm-up condition was not kept, so the 0.12 dB is not judged against the specification. Check the connector end face cleaning and any bend in the cord, set the reference again after a 15 minute warm-up and see whether the same difference repeats. Only if it repeats and exceeds the specification is a source check requested.
The second case is multimode 850 nm. Assume the cord on the source reads -24.0 dBm, and after wrapping it on the mandrel it reads -24.3 dBm. The drop of 0.3 dB is inside the 0.2 to 0.6 dB range the FOA describes. This is the FOA's method and not a manufacturer's EF guarantee, so if the equipment specification requires an EF cord, test with that cord. The numbers in both cases are assumptions.
-
A reference set before warm-up lies outside the specified interval
-
A difference inside the allowed width is still not judged if a condition was broken
-
The mandrel check is FOA guidance, not a manufacturer guarantee
What do you record when the check is done?
The record carries the source manufacturer and model, the datasheet number and edition, the emitter and selected wavelength, and the output setting. It also carries the time the source was switched on and the time the reference was set, the site temperature, the mode (CW, tone or auto wavelength), and for multimode tests the cord model, whether it is an EF cord, whether a mandrel was used and the drop it produced, and the date the cord reference was set and its use count. A stability figure carried into the budget includes the window, warm-up and temperature on the same line as the number and unit.
This lesson is limited to five manufacturer documents (AFL, two from VIAVI, two from Fluke) and three FOA documents. The text of TIA-526-14 and IEC 61280-4-1 was not read and is used only as the documents quote it. A calibration interval for the source alone, the spectral width definition in the AFL and Fluke CertiFiber Pro documents, and the module that the Fluke CertiFiber Max launch condition note refers to were not confirmed. There is no confirmation that current models carry the same values, and no EF measurement of real equipment. The Fluke CertiFiber Pro document is a 2017 revision and the AFL document a 2022 revision. Attach the datasheet of the equipment in use as the source.
-
Write the source model, document edition, selected wavelength and output setting together
-
Write the switch-on time, the reference time and the site temperature
-
Do not leave an unconfirmed item blank; write that it was not confirmed
Checklist
-
Did you find the emitter, wavelength and tolerance, spectral width definition and connector interface on the datasheet, and check that they suit the cord and the power meter in use?
-
Did you separate whether the output is a minimum, a typical value or a setting, and calculate the room to the lower end of the power meter range?
-
Did you carry the window, warm-up and temperature next to the stability figure and set the reference after the warm-up?
-
For multimode tests, did you check which cord the launch condition was stated at and record the cord model and use count?
-
Did you check the gap between the site temperature and the temperature where the specification holds, and write the datasheet edition in the record?
Review questions
1. If two sources are both specified as ±0.1 dB stability, are the values stated under the same conditions?
Answer and explanation: No. The ±0.1 dB of the AFL OLS1 is over 8 hours after a 5 minute warm-up, and the ±0.1 dB of the AFL OLS2 is over 8 hours after a 15 minute warm-up. The Fluke Pro single-mode states the same ±0.1 dB over 8 hours and ±0.08 dB over 15 minutes. Check the window, warm-up and temperature before comparing.
2. If a multimode source is stated as EF compliant, does the specification still apply when another jumper is used?
Answer and explanation: It cannot be assumed to apply. The EF compliance notes of VIAVI and Fluke say the value is at the output of the EF-TRC. It is a value for the source and the specified cord together, and reading that a different cord removes the condition the specification describes is the DMS interpretation.
3. For the 8 hour stability of ±0.25 dB of the VIAVI MPOLx, what is the largest difference the source alone can produce between the reference setting and the measurement?
Answer and explanation: If the two moments sit at opposite ends, 0.25 + 0.25 = 0.5 dB. DMS added the specification values for this worst case. It means something only while the document conditions hold (single channel, +5 to +45 °C, temperature change of ±0.3 K, after a 20 minute warm-up), and the real distribution is not known.
Sources
-
AFL: OLS Series Light Sources · OLS0-00-2000 Revision AC 2022-03-27, pages 1 to 3, page 2 rendered and checked
-
VIAVI: OLTS-85/85P SmartClass Fiber Optical Loss Test Sets · olts85-ds-nsd-nse-ae 30179546 004 0226, pages 1 to 2
-
VIAVI: SmartClass Fiber MPOLx MPO Optical Loss Test Sets · mpolx-ds-fit-nse-ae 30186091 906 0226, pages 1 to 3
-
Fluke Networks: CertiFiber Pro Optical Loss Test Set Datasheet · Rev 12/20/2017, page 7 rendered and checked
-
Fluke Networks: CertiFiber Max Optical Loss Test Set Datasheet · Revised January 14, 2026, page 1 and pages 7 to 9
-
FOA: Encircled Flux · 2019 copyright line, whole page
-
FOA: Fiber Optic Instruments · no date shown, the source and OLTS sections
-
FOA: Fiber Optic Testing · no date shown, the loss testing and reference cord sections