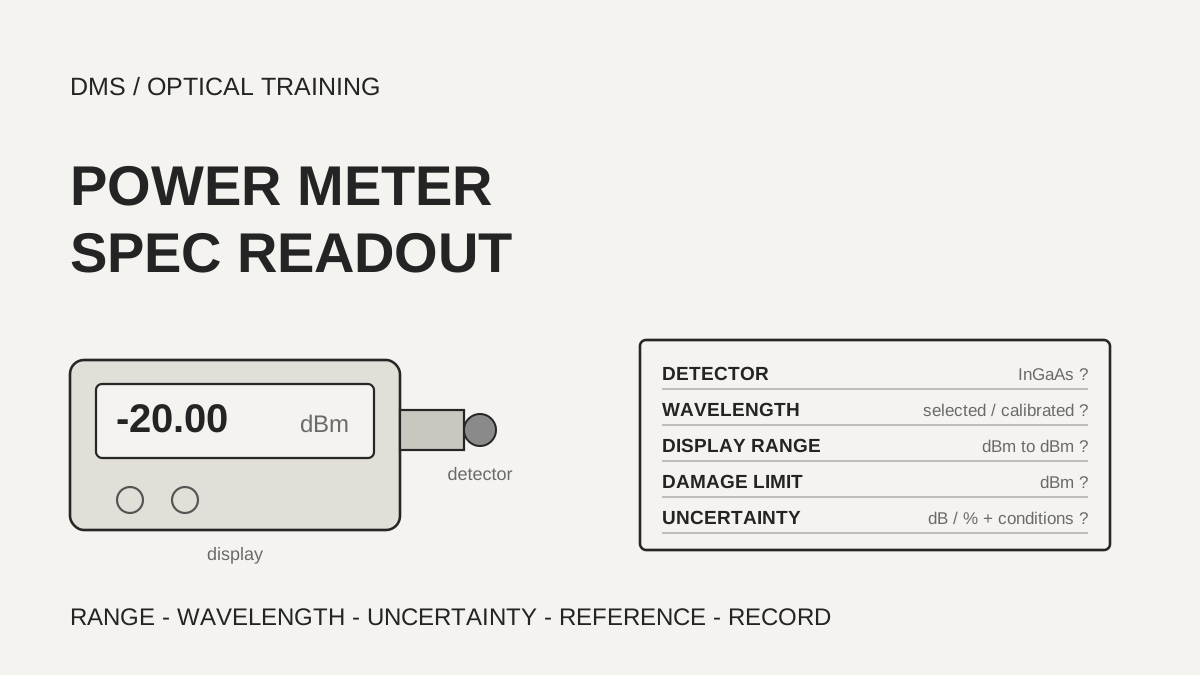
The uncertainty (the width around a reading within which the true value may lie) on an optical power meter datasheet is read together with the wavelength, signal level, temperature and connector conditions printed next to it, not copied as a bare number. In the documents reviewed, the same 0.25 dB was a value stated at -20 dBm in one document and a value at calibration conditions in another, and one manufacturer wrote its figure as a percentage plus an absolute floor. A link budget sheet therefore carries the uncertainty figure and its conditions on the same line.
Based on the manufacturer and organization documents reviewed on November 2, 2026.
Learning objectives
-
Find the detector, wavelength range, display range and damage limit on a power meter datasheet, and check that the source and the received signal in use sit inside them.
-
Read the conditions and the unit behind an uncertainty figure, convert it between dB and percent, and decide whether values from different documents can be compared on the same footing.
-
Turn calibrated wavelengths, errors at the ends of the range, reference setting and resolution into a checklist and carry them into the measurement record.
What do you read first on a power meter datasheet?
Read four boxes first: detector type, wavelength range, display range and damage limit. Every manufacturer power meter reviewed for optical communication used an InGaAs (indium gallium arsenide) detector. The FOA page says InGaAs and germanium detectors respond to roughly 800 to 1600 nm and silicon detectors to roughly 400 to 1100 nm. Whether a meter with a given name can measure both an 850 nm multimode source and a 1550 nm single-mode source is settled in the wavelength range box.
The top of the display range and the damage limit are different numbers. The VIAVI OLP-35V2 states a display range of -65 to +10 dBm and separately a "Max. power level" of +16 dBm. Quantifi states -60 to +10 dBm with a damage level of +12 dBm, and Kingfisher states +10 dBm with +15 dBm. No damage-limit box was found in the Fluke or Santec documents reviewed. The FOA page says that in high-output systems such as cable TV, small InGaAs detectors can saturate or be damaged, which is why meters with a window that attenuates by roughly 20 dB exist as a separate type.
Detector size also changes the range. The Santec OPM-110 manual lists the 1 mm InGaAs at 6 to -72 dBm, the 5 mm at 0 to -65 dBm and the 10 mm at 0 to -55 dBm, so a larger detector raises the weak-signal limit. The FOA page, describing germanium detectors, says noise grows with detector area, so a smaller detector reaches a lower floor, but the fiber end then has to be positioned close to the window and centered accurately.
As a DMS interpretation, when you receive a datasheet, find these four boxes first and check that the source wavelength, its output, and the weakest signal near the receiver all sit inside the range. If a document has no damage-limit box, record the limit as not confirmed and do not connect a signal above the display range.
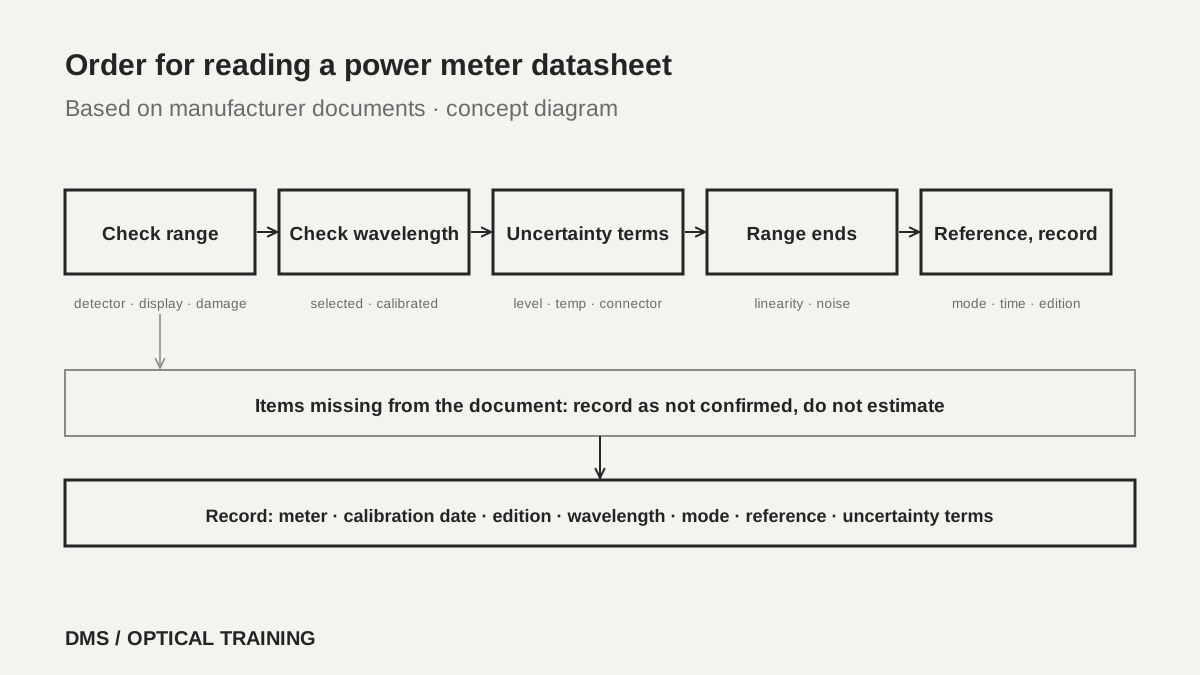 Order for reading a power meter datasheetView original
Scroll horizontally to view a wide table.
| Document and edition | Detector and wavelength | Display range | Damage limit |
|---|---|---|---|
| VIAVI OLP-35V2 (BN 2333/98.11, 2021.07) | InGaAs, adjustable 800–1650 nm | -65 to +10 dBm | Max +16 dBm |
| Quantifi Power 1401 (v0.10.10, 2022) | InGaAs, 750–1700 nm | -60 to +10 dBm | +12 dBm |
| Kingfisher KI 2600 InGaAs (no date shown) | InGaAs, 600–1700 nm | +10 to -60 or -70 dBm | +15 dBm |
| Fluke SimpliFiber Pro (Rev. 3, 2016) | InGaAs, six calibrated wavelengths | +10 to -52 or -60 dBm | Not found |
| Santec OPM-110 1 mm InGaAs (Ver. 1.0) | InGaAs, 850–1650 nm | 6 to -72 dBm | Not found |
-
Check first that the detector and wavelength range cover the source in use
-
The top of the display range and the damage limit are separate boxes
-
A larger detector area raises the limit on weak signals
What does an uncertainty figure include?
Do not compare uncertainty figures by number alone, because names and conditions differ by document. VIAVI states an intrinsic uncertainty and an overall measurement uncertainty separately. The intrinsic figure is for reference conditions of -11 dBm continuous wave, 1310 nm ±1 nm, 23 °C ±3 K, 45 to 75% relative humidity, a 9 µm test fiber and a 9° angled ceramic end face, and it is 0.2 dB (5%) in expert mode. The overall figure changes with wavelength: at 1310 and 1550 nm it is written as 0.25 dB together with 0.1 nW, at 850 and 980 nm and at 1490 and 1625 nm it is 0.35 dB, and at 1650 nm it is 0.45 dB. The document reviewed does not say how the two parts combine.
Fluke states ±0.25 dB and, in a footnote, the conditions 23 °C ±2 °C, -20 dBm, continuous wave, and a 9/125 µm fiber at 1310, 1490, 1550 and 1625 nm, with 0.1 dB added at 1625 nm. Quantifi states ±0.29 dB (typical) and ±0.50 dB (max), with footnotes for the +10 to -40 dBm range, 23 °C, excluding connectors, at calibration wavelengths. Santec states a total uncertainty of ±0.25 dB at calibration conditions for all NIST-traceable calibration wavelengths. Kingfisher states a total uncertainty of 0.3 dB (max) and says in a footnote that it includes the contributions of varying connector types, calibration uncertainty, linearity over temperature and range, and fiber core diameter.
The same 0.25 dB at one point of -20 dBm and a value that includes every connector type are different promises. The Quantifi value excludes connectors, while the Kingfisher value includes the variation of connector types. The documents reviewed do not allow these two to be compared on the same footing. How long a figure stays valid after calibration also differs: EXFO states that all its uncertainties are valid on the day of calibration, and no such sentence was found in the other documents.
Percent and dB convert directly. With 10 log10(1 + p/100), +5% is +0.21 dB and -5% is -0.22 dB, and 0.25 dB corresponds to about +5.9% and -5.6%. The EXFO ±5% is about ±0.2 dB, and the FOA page also gives 5% as about 0.2 dB. The 0.5 dB (12%) of the VIAVI OLP-38V2 matches the same calculation.
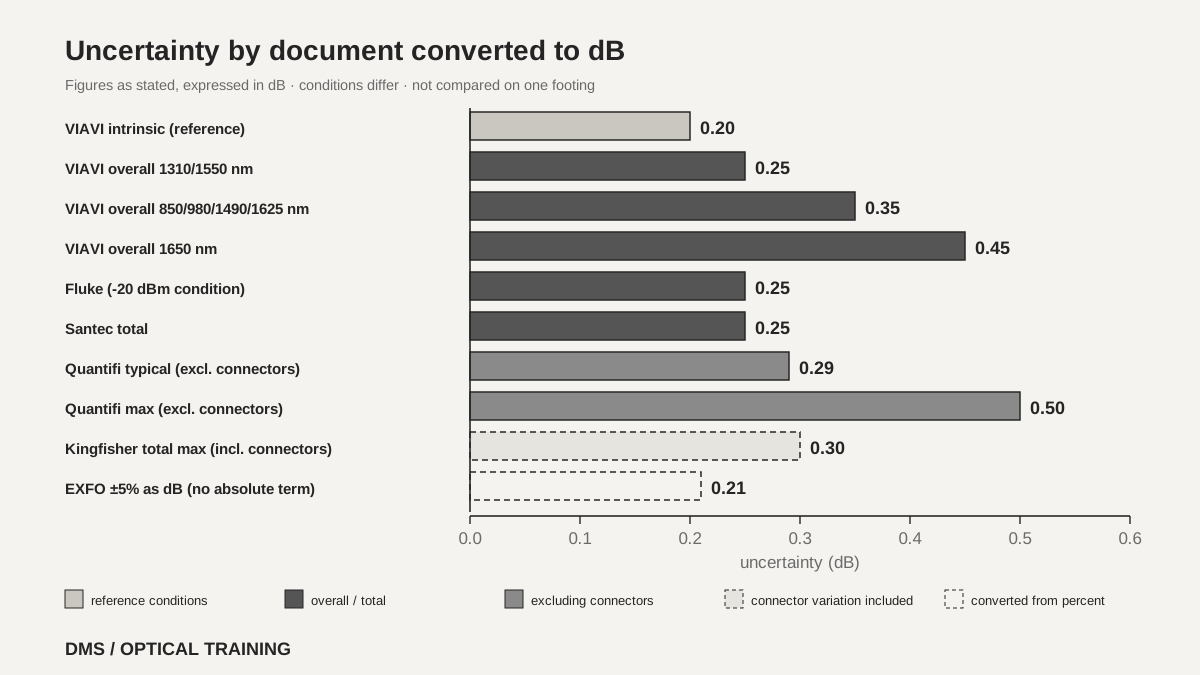 Uncertainty by document converted to dBView original
Scroll horizontally to view a wide table.
| Document | Uncertainty as stated | Conditions printed with it |
|---|---|---|
| VIAVI OLP-35V2 | Intrinsic 0.2 dB, overall 0.25–0.45 dB plus nW | Reference conditions, per wavelength |
| Fluke SimpliFiber Pro | ±0.25 dB | -20 dBm, 23 °C ±2 °C |
| Quantifi Power 1401 | ±0.29 dB typical, ±0.50 dB max | Excluding connectors, calibration wavelengths |
| Santec OPM-110 | ±0.25 dB | Calibration conditions, calibration wavelengths |
| EXFO FTBx-1750-031 | ±(5% + 3 pW) | 1550 nm, 23 °C ±1 °C, day of calibration |
| Kingfisher KI 2600 | 0.3 dB max | Connector variation included, bold-type wavelengths |
-
Carry an uncertainty figure together with its conditions
-
A value excluding connectors and one including them are not compared on the same footing
-
Convert a percentage to dB with 10 log10(1 + p/100)
How do calibrated and selected wavelengths differ?
The selected wavelength must match the wavelength of the incoming signal. The VIAVI manual says the sensitivity of the photodiode (the element that turns light into an electrical signal) depends on wavelength, and the wavelength setting of the device must match that of the incoming signal for a correct reading. The FOA page includes the calibration curve of a commercial power meter and says its detector sensitivity varies almost 7 dB over the meter's wavelength range. The one-page FOA-3 standard also gives the order: set the meter to the wavelength of the source and to dBm.
Within one document, the adjustable wavelength range and the calibrated wavelengths are separate lists. The VIAVI OLP-35V2 can be adjusted over 800 to 1650 nm in 1 nm steps, and its calibrated wavelengths are the eight values 850, 980, 1310, 1490, 1550, 1577, 1625 and 1650 nm. The Quantifi 1401 lists 850, 1310, 1490 and 1550 nm as calibration wavelengths, and its uncertainty footnote says "at calibration wavelengths". Fluke lists 850, 1300, 1310, 1490, 1550 and 1625 nm. So a wavelength that can be selected but is not calibrated cannot be assumed to carry the datasheet uncertainty.
Kingfisher shows this distinction through typeface. In the InGaAs detector row, 780, 820, 850 and 980 nm are in italics and wavelengths such as 1270 to 1625 nm are in bold, and footnote 5 says "at calibration wavelengths in bold type". Read as written, the 0.3 dB total uncertainty applies at the bold wavelengths, and 850 nm is not among them. This distinction disappears when only the text is extracted, so it was checked on the rendered PDF page.
EXFO accepts a wavelength entry resolution of 0.01 nm, but its uncertainty is adjusted by wavelength range. For the 1 mm InGaAs module the stated figure holds between 1000 and 1640 nm, with 1% added below 1000 nm and 6% above 1640 nm. The sheet also says the wavelength must not coincide with a water absorption line. The wavelengths FOA-3 gives for single-mode work are 1310, 1490 and 1550 nm, so first check whether the wavelength in use is in the calibration list of the datasheet.
-
Set the meter to the wavelength of the source
-
Selectable wavelengths and calibrated wavelengths are different lists
-
Find in the footnotes which wavelengths the uncertainty applies to
How do errors change at the ends of the range?
The middle and the ends of the display range are not the same promise. Fluke splits linearity (how closely the reading follows the signal as its level changes) at 1300 to 1625 nm into ±0.1 dB from 0 to -55 dBm and ±0.2 dB above 0 dBm and below -55 dBm, and at 850 nm into ±0.2 dB from 0 to -45 dBm and ±0.25 dB below -45 dBm. Quantifi gives ±0.1 dB from -40 to 0 dBm and ±0.2 dB from -50 to -40 dBm. Kingfisher says in a footnote that its midrange linearity excludes the top 5 dB and bottom 10 dB of the range.
Noise adds to the error at weak signals. The FOA page says that a signal 10 dB above the noise floor has an offset error of 10%, about 0.4 dB, and that one manufacturer specifies its measurement range 10 dB above the noise floor while another specifies only 3 dB above, which can cause an error of 50%. The documents of the manufacturers named in that claim were not read. VIAVI states 0.25 dB together with 0.1 nW, and EXFO states ±(5% + 3 pW), so both give a relative part and an absolute part.
Putting signal levels into the EXFO expression, as an assumption, shows how the uncertainty grows on the weak side. The values below are not manufacturer values: DMS calculated them from ±(5% + 3 pW), and they mean something only while the document's conditions (1550 nm, 23 °C ±1 °C, 1 s averaging, after nulling) hold. Down to -60 dBm the figure stays near 5%, at -80 dBm it grows to 35%, and at -85 dBm the 3 pW term is about as large as the signal, so the lower side in dB cannot be defined.
As a DMS interpretation, when the weakest signal in a link budget sheet sits near the end of the display range or the linearity range, do not use the midrange uncertainty. Use the figure the datasheet gives for that segment, and if the document gives none, record it as not confirmed.
Scroll horizontally to view a wide table.
| Signal level | Uncertainty (calculated from the expression) | In dB |
|---|---|---|
| -40 dBm | about 5.0% | +0.21 / -0.22 dB |
| -60 dBm | about 5.3% | +0.22 / -0.24 dB |
| -70 dBm | about 8.0% | +0.33 / -0.36 dB |
| -80 dBm | about 35% | +1.30 / -1.87 dB |
| -85 dBm | about 100% | Lower side cannot be defined |
-
The middle and the ends of the range are written as different numbers
-
At weak signals an absolute part is added to the relative part
-
When the weakest signal is near the end of the range, look for the figure of that segment
What do reference setting and resolution change?
dBm is absolute power and dB is a ratio to a reference the user sets. The FOA page says 0 dBm is 1 mW, that setting a reference makes the meter read 0 dB, and that loss is by convention stated as a positive number although the meter reads a negative one. In the Santec OPM-110 software, capturing a reference switches the display to dB mode, and the button that returns to dBm mode works only after a reference has been taken. Kingfisher says it stores and shows a separate reference for each wavelength. FOA advises setting the reference before measuring loss and checking it now and then during the work.
If the reference is taken with the same meter and only a difference of a few dB is measured, the error shrinks. The FOA page says that when a reading of a few dB does not cross an autorange point the error is usually very small, around 0.0x dB, and that it can be larger if the measurement includes the autorange point. By contrast, when the absolute readings of two different meters are compared, FOA says that with ±5% (about 0.2 dB) on each, the worst case in opposite directions is a 10% difference, about 0.4 dB.
Resolution is not uncertainty. Santec lists a resolution of 0.001 dB with a total uncertainty of ±0.25 dB. VIAVI lists a resolution of 0.01 dB with an overall uncertainty of 0.25 dB or more. FOA puts the uncertainty of an optical power measurement at about 0.2 dB (5%) and of a loss measurement at 0.2 to 0.5 dB or more, and gives the opinion that field instruments are better with resolution limited to 0.1 dB because readings are steadier and closer to the real uncertainty. That last sentence is FOA's opinion.
As a DMS interpretation, a loss record carries how and when the reference was set and which reference cord was used. Even if the display shows two decimals, digits below the uncertainty are not used for a pass or fail decision.
-
dBm is absolute power and dB is a ratio to a reference
-
The error differs between a few-dB difference on one meter and a comparison of two meters
-
A fine resolution does not mean a small uncertainty
How is the datasheet read in a hypothetical case?
The situation below is assumed for teaching and is neither a real site nor a real measurement. Two power meters are connected to the same 1310 nm source with the same patch cord, and A reads -18.2 dBm while B reads -18.6 dBm. Assume A has a Fluke-type specification of ±0.25 dB (at -20 dBm) and B a Quantifi-type specification of ±0.29 dB typical and ±0.50 dB max (excluding connectors).
First confirm that both meters are set to 1310 nm and dBm mode. Second, check that the -18 dBm signal is inside the conditions of both specifications (around -20 dBm, and +10 to -40 dBm). Third, check that the adapters and connection end faces were cleaned. Then compare the 0.4 dB difference with the specifications. The simple sum of the two maximum values is 0.25 + 0.50 = 0.75 dB and the sum of the typical values is 0.25 + 0.29 = 0.54 dB, so 0.4 dB is inside what the two specifications allow. This is a worst-case simple sum, and the real distribution is not known.
So this difference alone does not justify calling either meter faulty. Swap the two meters on the same source and cord to see whether the difference repeats, record the calibration dates and the specification conditions, and send a meter for calibration only if the difference still exceeds the specifications. In the link budget sheet, write the uncertainty and the conditions of the meter actually used.
-
Check first that the wavelength setting and mode are the same on both meters
-
Confirm that the signal level is inside the conditions of each specification
-
A difference inside the allowed width is not a ground for calling a meter faulty
What do you record when the check is done?
The record carries the maker and model of the power meter, the detector type, the calibration date (Fluke shows its factory calibration date through a key combination at power-on), and the document number and edition of the datasheet. Add the selected wavelength and whether it is a calibrated wavelength, the mode (dBm or dB), how and when the reference was set, the reference cord and adapter type used, and whether they were cleaned. For an uncertainty carried into the budget sheet, write not only the number and unit but also the level, temperature, connector inclusion, and whether the figure is typical or maximum, on the same line. FOA-3 asks for the test date, the operator, the test equipment, the cable and fiber identification, the test wavelength and the measured power.
This material is limited to six manufacturer documents (VIAVI, Fluke, Quantifi, Santec, EXFO and Kingfisher) and two FOA documents. The text of a calibration or measurement standard was not read, and the Jonard FPM-55 manual was not used because access was refused. The Kingfisher document shows no date, and how the 0.25 dB and 0.1 nW of VIAVI combine is not stated in the document. No manufacturer-recommended calibration interval was read, while FOA says annual recalibration should be done. Whether current models carry the same values, and any check of a specification by actual measurement, were not confirmed. For that reason, attach the datasheet of the meter in use as the source.
-
Record the instrument, calibration date, document edition, selected wavelength and mode together
-
Write the level, temperature and connector conditions on the same line as the uncertainty
-
Write items not confirmed as not confirmed instead of leaving them blank
Checklist
-
Did you find the detector, wavelength range, display range and damage limit boxes and check that the source and the received signal are inside them?
-
Did you carry the level, temperature, wavelength and connector conditions printed next to an uncertainty figure, and whether it is typical or maximum?
-
Did you set the wavelength to the source wavelength and check that it is a calibrated wavelength on the datasheet?
-
Did you check that the weakest signal is not near the end of the display range or the linearity range?
-
Did you record how and when the reference was set, the mode (dBm or dB), the calibration date and the datasheet edition?
Review questions
1. If two power meters are both specified as ±0.25 dB, are the values stated under the same conditions?
Answer: No. The Fluke ±0.25 dB is stated at -20 dBm, 23 °C ±2 °C and continuous wave, while the Santec ±0.25 dB is stated at calibration conditions for NIST-traceable calibration wavelengths. Check the level, temperature, connector inclusion and whether it is typical or maximum before comparing them.
2. If a signal above the top of the display range of +10 dBm stays within the damage limit, is it acceptable to connect it?
Answer: The damage limit and the display range are separate boxes. The VIAVI OLP-35V2 gives +16 dBm as a maximum next to a display range of +10 dBm, and Quantifi gives +12 dBm as a damage level. Even inside the damage limit, a signal above the display range is not explained by the specification, so it is not used for an accurate measurement. That last sentence is a DMS interpretation.
3. What is the uncertainty of a -80 dBm signal under the EXFO 1 mm InGaAs expression ±(5% + 3 pW)?
Answer: -80 dBm is 10 pW, so adding the 30% from 3 pW divided by 10 pW to the 5% gives about 35%, which is about +1.30 dB and -1.87 dB. This value is a DMS calculation from the expression and means something only while the document's wavelength, temperature, averaging and nulling conditions hold.
Sources
-
VIAVI: OLP-35V2/-35SC/-38V2 SmartPocket V2 User manual · BN 2333/98.11, 2021.07, pages 17 to 18 and 29
-
Fluke Networks: SimpliFiber Pro Users Manual · Rev. 3, March 2016, FS copy, pages 32 to 33
-
Quantifi Photonics: Power 1400 Series Specification Sheet · v0.10.10, 2022, pages 6 to 7
-
Santec: OPM-110 USB Optical Power Meter Instruction manual · OPM-110-M-E-Ver.1.0, CODE-2023-11, PDF pages 9 and 11
-
EXFO: FTBx-1750/OHS-1700 Spec sheet · FTBX1750/OHS1700.11EN, printed April 2026, pages 3 to 4
-
Kingfisher: KI 2600 Series Hand Held Fiber Meter · no date shown, reseller copy, page 2 rendered and checked
-
FOA: Measuring Power · no date shown, whole page
-
FOA: FOA-3 Measuring Optical Power In Fiber Optic Systems · FOA-3a, shown as January 12, 2025, page 1