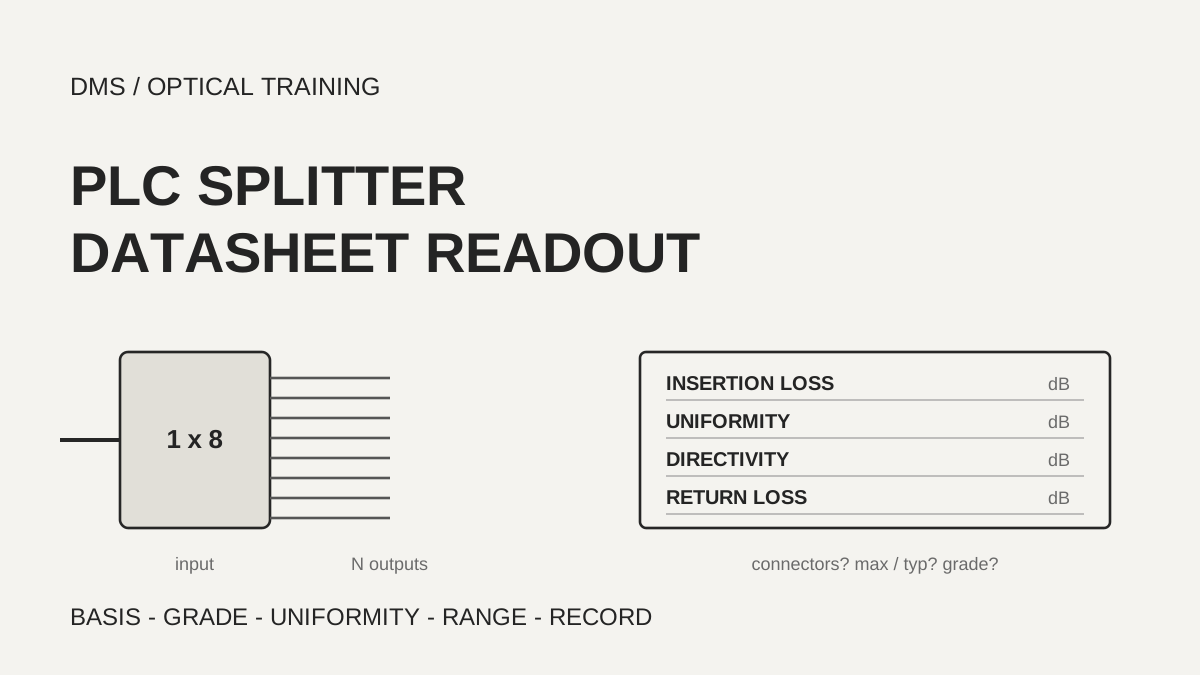
Before the insertion loss of a PLC splitter (a planar lightwave circuit splitter, a passive part that divides light among several fibers) is copied into a link budget, three things are read first: whether the number includes connectors, whether it is a maximum or a typical value, and under what conditions it was measured. In the documents reviewed, the maximum insertion loss of the same 1x32 split ranged from 16.5 dB to 17.5 dB, and two manufacturers stated the difference together with whether connectors are included or with wavelength and temperature conditions. A datasheet number is therefore carried over together with its conditions.
Based on the manufacturer and organization documents reviewed on October 31, 2026.
Learning objectives
-
Find, in a datasheet, whether the insertion loss includes connectors, whether it is a maximum or a typical value, and the grade wording, and compare only numbers with the same conditions.
-
Explain what uniformity, directivity and return loss measure, and give each its own column in the budget.
-
Compare the per-port loss measured in the field with the matching row of the datasheet and record the conditions with it.
What is included in the insertion loss on a PLC splitter datasheet?
A splitter that divides power equally among N output fibers has an ideal splitting loss of 10 log10 N dB. For a 1x8 that is about 9.03 dB, and for a 1x32 about 15.05 dB. FOA also says that each doubling of the split costs 3 dB, and that excess loss from the manufacturing process (loss beyond the ideal splitting loss) and perhaps the connectors on a splitter module are added on top. The insertion loss in the datasheet tables read here looks like the splitting loss plus excess loss, and whether connectors are inside that number is stated separately in each document.
Three Broadex documents show this clearly. The bare form, with a bare fiber input and a fiber ribbon output, states that its specifications exclude connectors. The blockless form with 900 µm loose tubes and the ABS module form state that their specifications include connectors. All three say the measurements were made at room temperature. The maximum insertion loss for the P grade rises by 0.5 dB from the bare form to the blockless form: from 10.5 dB to 11.0 dB for a 1x8 and from 16.5 dB to 17.0 dB for a 1x32. In the same comparison a 1x4 rises only 0.3 dB, from 7.2 dB to 7.5 dB. The maximum uniformity is the same in both forms. This difference belongs to the two product families, and it is not carried over as a general value for the loss of one connector pair.
The Senko white paper cites Telcordia GR-1209 and gives the maximum allowable insertion loss of a PON splitter as 0.8 + 3.4 log2 N dB for a 1xN and 1.0 + 3.4 log2 N dB for a 2xN, and says these calculations do not include connector loss. With N equal to 8 the result is 11.0 dB, and with N equal to 32 it is 17.8 dB. The standard itself was not read, so the formula stays as the white paper transcribes it, and no claim is made that the requirement was checked in the standard.
The example table in the FOA test page lists a typical loss of 11 dB for a 1x8 and 19 dB for a 1x32. It adds a maximum excess loss of 2 dB and 4 dB to the ideal 9 dB and 15 dB. These numbers are larger than the 16.5 dB to 17.5 dB for a 1x32 in the manufacturer tables, so a general example and the datasheet of the product to be bought are read for their own purposes and are not mixed.
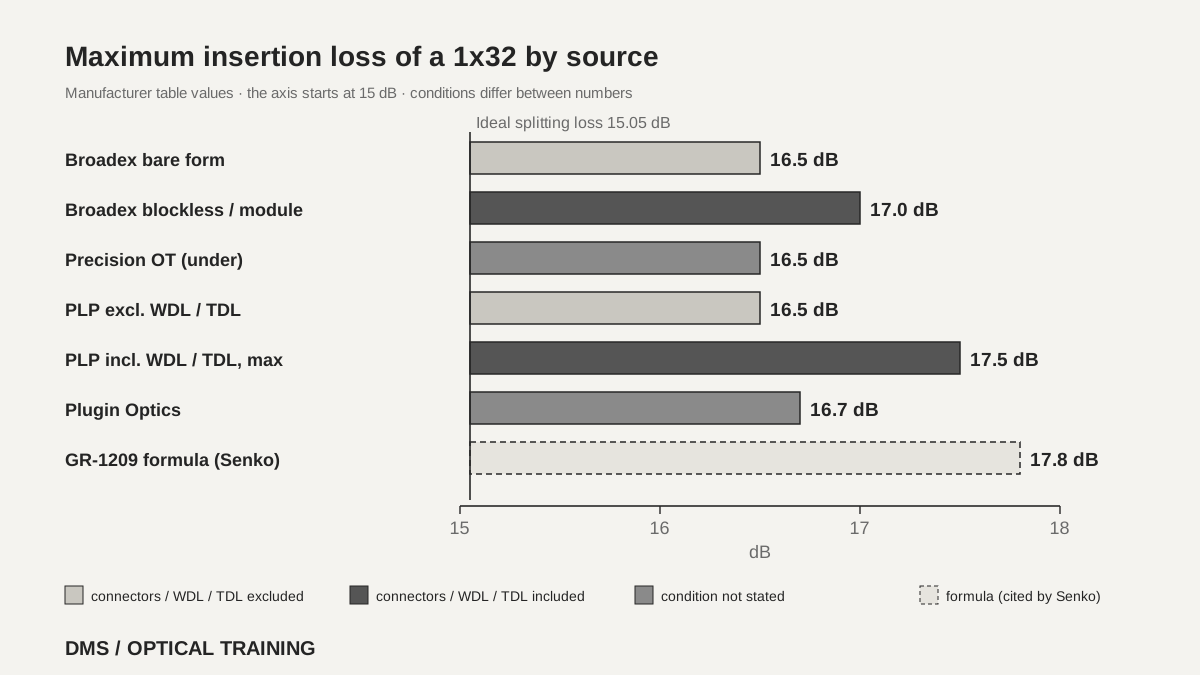 Maximum insertion loss of a 1x32 by sourceView original
Scroll horizontally to view a wide table.
| Source and stated conditions | 1x8 maximum | 1x32 maximum |
|---|---|---|
| Broadex bare form (P grade, connectors excluded, room temperature) | 10.5 dB | 16.5 dB |
| Broadex blockless and module forms (P grade, connectors included, room temperature) | 11.0 dB | 17.0 dB |
| Precision Optical Technologies 2024-04-10 (less-than sign, no connector or temperature condition stated) | under 10.3 dB | under 16.5 dB |
| PLP COYOTE 2019 (one table for bare and connectorized, WDL and TDL excluded, room temperature, 1310 and 1550 nm) | 10.5 dB | 16.5 dB |
| PLP COYOTE 2019 (maximum in the same table with WDL and TDL included) | 11.5 dB | 17.5 dB |
| Plugin Optics 2025-09 (ABS box with LC/APC pigtails, no maximum or typical split) | 10.5 dB | 16.7 dB |
| GR-1209 formula as transcribed by Senko (connectors excluded) | 11.0 dB | 17.8 dB |
-
Insertion loss is the splitting loss, the excess loss and, in some cases, connector loss
-
Even within one maker the connector basis differs by form
-
A datasheet number goes into the budget with its basis
How are maximum, typical and grade wording read?
The Broadex tables split insertion loss into typical and maximum values, and split the maximum into a P grade and an S grade. The notes say P is premium and S is standard. The 1x32 bare form is typical 16.3 dB, maximum P 16.5 dB and maximum S 16.9 dB, and the blockless form is typical 16.8 dB, maximum P 17.0 dB and maximum S 17.5 dB. At the same split ratio the maximum differs by 0.2 dB to 0.5 dB between grades, and the minimum return loss also differs, 55 dB for P and 50 dB for S. As a DMS interpretation, a purchase specification that does not name the grade leaves it unclear which row is being accepted.
The PLP COYOTE document puts three numbers in one cell and separates them with footnotes. For the 1x32, 16.5 dB is the value measured without wavelength dependent loss (WDL) and temperature dependent loss (TDL), at room temperature and at 1310 nm and 1550 nm, while the maximum of 17.5 dB and the typical 17.2 dB include WDL and TDL. In this document the typical value of 17.2 dB is therefore larger than the 16.5 dB of the other condition. Reading the table on the assumption that a typical value is smaller than a maximum compares numbers of different conditions. The 1x2 column prints a typical value of 7.7 dB, the same number as the 1x4 column, and which one is right was not confirmed, so the 1x2 value is not used.
The Precision Optical Technologies (POT) and Plugin Optics tables each give a single number. POT puts a less-than sign on the 1x32 insertion loss, 16.5 dB, and Plugin Optics gives 16.7 dB for the 1x32 without saying whether it is a maximum or a typical value. POT lists bare, mini-type, ABS module, LGX cassette and 1RU forms and UPC and APC connector choices in one document, yet has only one optical characteristics table. On the page read (page 3), no wording was found that says whether that table includes connectors.
Scroll horizontally to view a wide table.
| Item (Broadex) | 1x8 | 1x32 |
|---|---|---|
| Bare form typical | 10.0 dB | 16.3 dB |
| Bare form maximum P / S | 10.5 / 10.7 dB | 16.5 / 16.9 dB |
| Blockless and module forms typical | 10.5 dB | 16.8 dB |
| Blockless and module forms maximum P / S | 11.0 / 11.2 dB | 17.0 / 17.5 dB |
-
Maximum, typical and the P and S grades are different rows
-
A typical value can be larger than a maximum stated under another condition
-
A table without a maximum and typical split is recorded as having none
What do uniformity, directivity and return loss mean?
In the Senko white paper, uniformity is checked from the insertion loss test results: the difference between the highest loss and the lowest loss must be within the allowed value. Directivity (the amount of light that appears at another input port) is measured in a way similar to insertion loss, with the source on one input port and the power meter on another input port, looking at light returning into that other input. Return loss is the fraction of power that comes back to the same port, and a higher value means less light is reflected back to the transmitting port.
The numbers in the tables read are close to each other. The 1x8 uniformity is 0.8 dB in Broadex, POT, PLP and Plugin Optics, and the 1x32 is 1.5 dB in Broadex, POT and Plugin Optics and 1.7 dB in PLP. Directivity is 55 dB or more in all four documents, and return loss is also 55 dB or more, with Broadex alone giving 50 dB for its S grade. Polarization dependent loss (PDL) is, as the name says, how much the loss changes with the polarization state of the light, and its maximum is stated as 0.2 dB to 0.3 dB for a 1x8 and 0.3 dB for a 1x32. The POT table prints the PDL unit as nm, which looks like a misprint of dB, but this was not confirmed.
The documents read do not say whether the maximum insertion loss is an upper limit for every output port, or whether it already includes uniformity. For the Broadex bare 1x32, the typical insertion loss of 16.3 dB plus the typical uniformity of 0.8 dB is 17.1 dB, which is larger than the maximum insertion loss of 16.5 dB. Because the document does not explain how the two numbers relate, a DMS interpretation is to keep a column for maximum insertion loss and a separate column for uniformity in the budget, and not to delete either value until the document states the relation.
Scroll horizontally to view a wide table.
| Item | Meaning in the documents read | Values read for 1x8 and 1x32 |
|---|---|---|
| Uniformity | Difference between the highest and the lowest loss (Senko) | 1x8 0.8 dB, 1x32 1.5 dB or 1.7 dB |
| Directivity | Light from one input appearing at another input (Senko) | 55 dB or more |
| Return loss | Light returning to the same port, higher means less reflection (Senko) | 55 dB or more, 50 dB for the Broadex S grade |
| Polarization dependent loss | Change in loss with polarization state | 1x8 0.2 to 0.3 dB, 1x32 0.3 dB |
-
Uniformity is the spread between ports and is a column apart from insertion loss
-
Directivity and return loss concern light coming back
-
The relation between maximum insertion loss and uniformity is not in the documents, so the columns are kept apart
What is matched in the wavelength and temperature ranges?
Of the tables read, Broadex, POT and PLP state an operating wavelength of 1260 to 1650 nm. The Plugin Optics table gives 1260 to 1625 nm, while the feature list of the same document says a 1260 to 1650 nm window, so the end value differs inside one document. The Senko white paper says a PON uses 1490 nm downstream and 1310 nm upstream, an RF video overlay is usually at 1550 nm, and network testing and surveillance use 1550 nm or 1625 nm under ITU L.41. As a DMS interpretation, for a route that is monitored at 1625 nm, the end of the datasheet wavelength range is checked to see that it covers that wavelength.
The operating temperature is -40 to +85 °C in Broadex, PLP and Plugin Optics, and -20 to +80 °C in POT. Among the documents read, only POT states a maximum input power of 500 mW (27 dBm) and an operating humidity of 5 to 95 %. The range needed depends on whether the splitter sits on a pole, in a manhole or in a cabinet, so this lesson does not say which is better. It goes as far as writing the datasheet range next to the installation conditions.
-
Check that the datasheet wavelength range covers the monitoring wavelength in use
-
Record it when one document gives different end values
-
Write the temperature range next to the installation conditions
Which row of the datasheet is a field test result compared with?
FOA says to test a splitter with the same double-ended loss test used for patch cords and cable plant (OFSTP-14). A 0 dB reference is set with a launch reference cable, the source is connected to the input, and the receive cable and power meter are moved from one output port to the next. For singlemode, FOA says to tie a small loop in the launch cable and set the 0 dB reference with that loop in place. The loss measured this way contains the splitting loss, the excess loss and the input and output connectors, so it is the loss to expect once the splitter is plugged into a cable plant. The upstream direction is tested by reversing the setup, and a 1x32 means moving the source 32 times.
A field value is therefore compared with the row of the datasheet that includes connectors. Comparing it directly with the connector-excluded value of a bare form leaves connector loss only in the test result, which tilts the pass or fail decision to one side. This order is a DMS interpretation based on the FOA description. Uniformity is calculated from the per-port results as the difference between the largest and the smallest value, and results at different wavelengths are kept apart by wavelength and not merged into one number.
 Order from reading the datasheet to the recordView original
-
Set the 0 dB reference the FOA way and measure one output port at a time
-
The test value contains the connectors, so compare it with a row that includes connectors
-
Uniformity is the largest minus the smallest per-port value
How is the order set in a hypothetical case?
The situation below is assumed for teaching and is not a real site or a real measurement. Suppose two quotes arrive for a 1x32 splitter that is to go into a distribution box. One states a maximum of 16.5 dB in the datasheet of a bare form without connectors, and the other states a maximum of 17.0 dB in the datasheet of a connectorized module. Compared as they stand, the module looks 0.5 dB worse, but the first number excludes connectors, so the two do not share a condition.
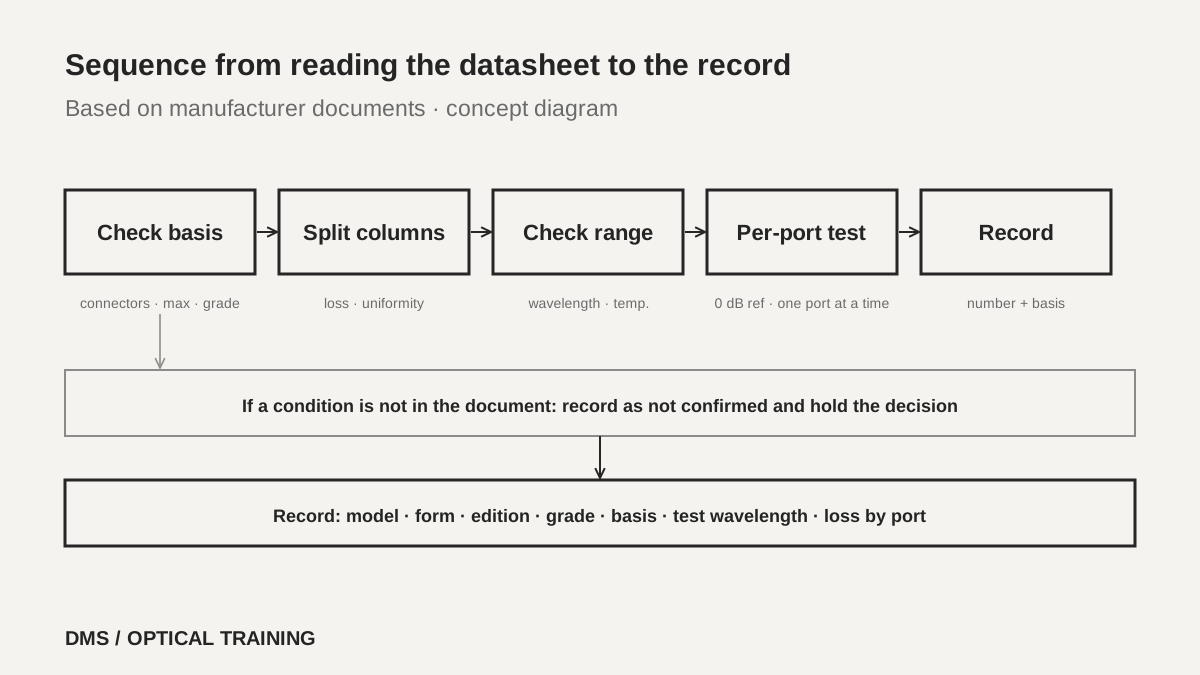
The order is set like this. First, find the sentence in each datasheet that says whether connectors are included, and match typical against maximum and the grade such as P and S. Write uniformity, directivity, return loss, the wavelength range and the temperature range side by side, and for items the document does not give, write that they could not be confirmed instead of leaving the cell empty. In the splitter cell of the budget, write the number together with the basis, the grade and the edition of the document. At receiving or after installation, measure the loss of each port the FOA way and compare it with the row that includes connectors, and hold the pass or fail decision when a condition is missing from the document so the comparison cannot be made.
-
Match the connector basis of the two quotes first
-
Write the number, basis, grade and edition together in the budget
-
Items without a stated condition are recorded as not confirmed and the decision is held
What is recorded when the check is finished?
The record lists the manufacturer, model, split ratio, form (bare, blockless, module, cassette) and the edition or revision date of the datasheet used. It also notes whether the insertion loss is a maximum or a typical value, whether connectors are included, and what the grade is, with uniformity, directivity, return loss, the wavelength range and the temperature range beside them. If a field test was done, it lists the test wavelength, how the reference was set, the loss by port number and the direction.
The material is limited to seven manufacturer documents (including the three from Broadex) and one FOA document. The text of Telcordia GR-1209 and of the ITU-T recommendations was not read, and it was not confirmed whether the maximum insertion loss is an upper limit for every port, whether uniformity is included, what a general value for connector loss is, or the details of the measurement conditions the documents mention. The 3M datasheet could not be downloaded and was not read, and whether models on sale today carry the same values and a test on real equipment were not confirmed either. Each item therefore carries the datasheet of the splitter in use as its source.
-
Write model, form, edition, grade and connector basis together
-
Write test values together with wavelength, reference method, port number and direction
-
Record conditions that could not be confirmed as not confirmed
Checklist
-
Did you find in the datasheet of the splitter in use the sentence that says whether insertion loss includes connectors?
-
Does the budget say whether the value is a maximum or a typical value, and whether the grade is P or S?
-
Did you write uniformity, directivity and return loss in columns apart from insertion loss?
-
Did you check that the datasheet wavelength and temperature ranges cover the monitoring wavelength and the installation site?
-
Did you compare the field test value with a row that includes connectors and record the test conditions with it?
Review questions
1. If one datasheet states a 1x32 maximum insertion loss of 16.5 dB and another states 17.0 dB, is the 17.0 dB product worse?
Answer and explanation: That cannot be said right away. Broadex states that its bare form excludes connectors and that its blockless and module forms include them, and the P grade 1x32 maximum is 16.5 dB and 17.0 dB. The comparison is made after the basis and the grade are matched.
2. Is a typical value always smaller than a maximum value?
Answer and explanation: It is read that way only when the conditions are the same. In the PLP COYOTE document the 1x32 shows 16.5 dB without WDL and TDL, and a maximum of 17.5 dB and a typical 17.2 dB with them, so the typical value is larger than the value of the other condition. The footnote conditions are read first.
3. If uniformity is within the datasheet value, is the loss the same at every port?
Answer and explanation: No. Uniformity checks whether the difference between the highest and the lowest loss among the ports is within the allowed value. The 1.5 dB read for a 1x32 means a spread of that size is allowed between ports, so the test values of all ports are checked.
Sources
-
Broadex Technologies: PLC Splitter, Blockless PLC Splitter and PLC Splitter Module datasheets (three documents) · copyright 2020, file names dated September 17, 2021, specifications and notes on pages 1 to 2 of each
-
Precision Optical Technologies: PLC Splitters · revision date 2024-04-10, pages 1 to 4
-
Preformed Line Products: COYOTE PLC Splitters · CO-CA-1004-10, dated 2019, specification table and footnotes on page 83
-
Plugin Optics: 1xN PLC Splitters ABS Pigtail Product Bulletin · Doc. No. 125-ABv3.0, dated September 2025, pages 1 to 2
-
Senko: Passive Optical Splitter White Paper · dated November 2021, cites Telcordia GR-1209 and GR-1221, pages 8 to 10, 13 and 15
-
FOA: Testing Fiber Optic Couplers, Splitters Or Other Passive Devices · no page date, whole page