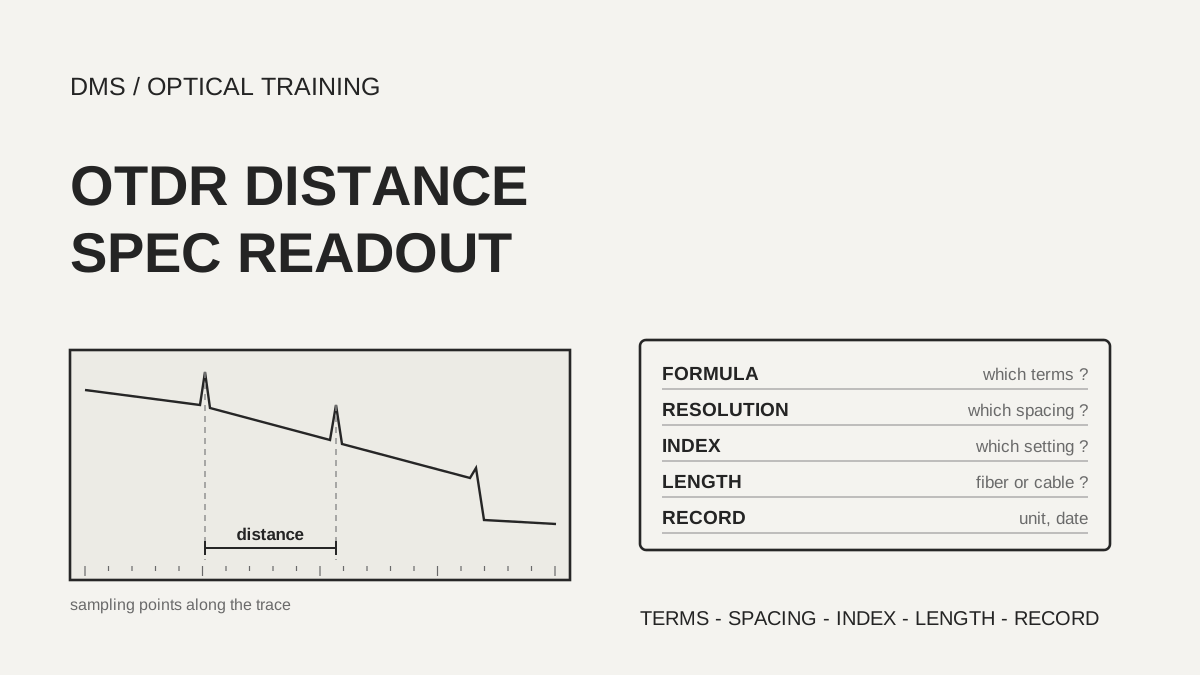
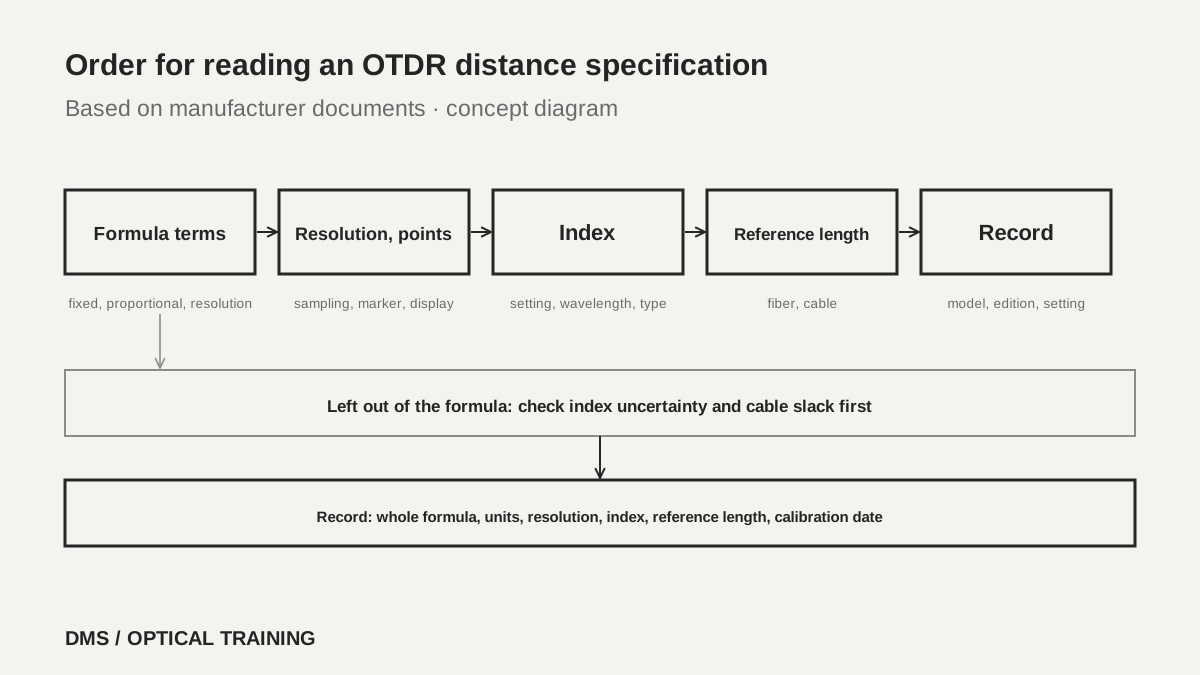
An OTDR (optical time-domain reflectometer) datasheet states distance accuracy as a fixed distance plus a term proportional to the measured distance plus a sampling resolution term, and every document reviewed leaves the error of the index-of-refraction setting out of that formula. In a hypothetical 20 km link with a 1 m resolution, the formulas read land between ±1.7 m and ±2.75 m, but an index entered 0.0005 off moves the reading by about 6.8 m, and mistaking fiber distance for cable length moves it by about 198 m if the roughly 1 % excess fiber that FOA describes applies. So when you compare distance figures, copy the index setting and the reference length into the test record next to the formula terms.
Documents checked on November 6, 2026: the manufacturer and organization documents listed under Sources.
Learning objectives
-
Find the fixed term, the distance-proportional term, the resolution term and the units in a distance accuracy formula, and check whether index uncertainty has been left out.
-
Separate sampling resolution, sampling point count and display resolution as different pieces of information, and calculate the spacing you get by dividing the distance range by the point count.
-
Calculate how far an index setting and the difference between fiber length and cable length move a displayed distance, and carry the setting and the reference length into the test record.
Which terms make up an OTDR distance accuracy formula?
In every product document reviewed, the distance accuracy or uncertainty was a sum of a fixed distance, a term proportional to the measured distance and a resolution term. The EXFO MaxTester 720D and 735D give ±(0.75 m + 0.0025 % × distance + sampling resolution), and the 715D has 0.005 % for the proportional term. The VIAVI SmartOTDR 100A/B datasheet reads (±1 m) ± (sampling resolution) ±(1.10⁻⁵ × distance). The same company's 4100 series user manual sets the fixed term at ±1 m for MM and QUAD modules and ±0.5 m for A, B and C modules, and adds ± sampling resolution ±10⁻⁵ × distance to both. The Anritsu MT9085 brochure gives ±1 m ±3 × measurement distance × 10⁻⁵ ± marker resolution.
The Fluke OptiFiber Pro data sheet gives ±(1 + 0.0005 × distance + 0.5 × resolution) on the page that continues its HDR module specification table, and no unit appears anywhere. Read the distance in meters and the proportional term is 10 m at 20 km, read it in kilometers and it is 0.01 m, a factor of a thousand. DMS therefore does not calculate this formula in the same table as the others and leaves it as unit confirmation required. The VIAVI SmartOTDR datasheet writes its coefficient as 1.10⁻⁵, and DMS read it as 1×10⁻⁵ to match the 10⁻⁵ × distance in the same company's manual. The document itself does not explain that reading.
The conditions and the excluded terms also differ from document to document. The EXFO sheets state that all specifications are valid at 23 °C ± 2 °C with an FC/APC connector, and the VIAVI datasheet gives typical values at 25 °C. In every document reviewed, index uncertainty sits outside the formula. EXFO says in a footnote that it does not include the uncertainty due to fiber index, the VIAVI datasheet excludes group index uncertainties, and the VIAVI manual and Anritsu exclude the error of the refractive index calibration. On the pages read, the Fluke data sheet has no such wording.
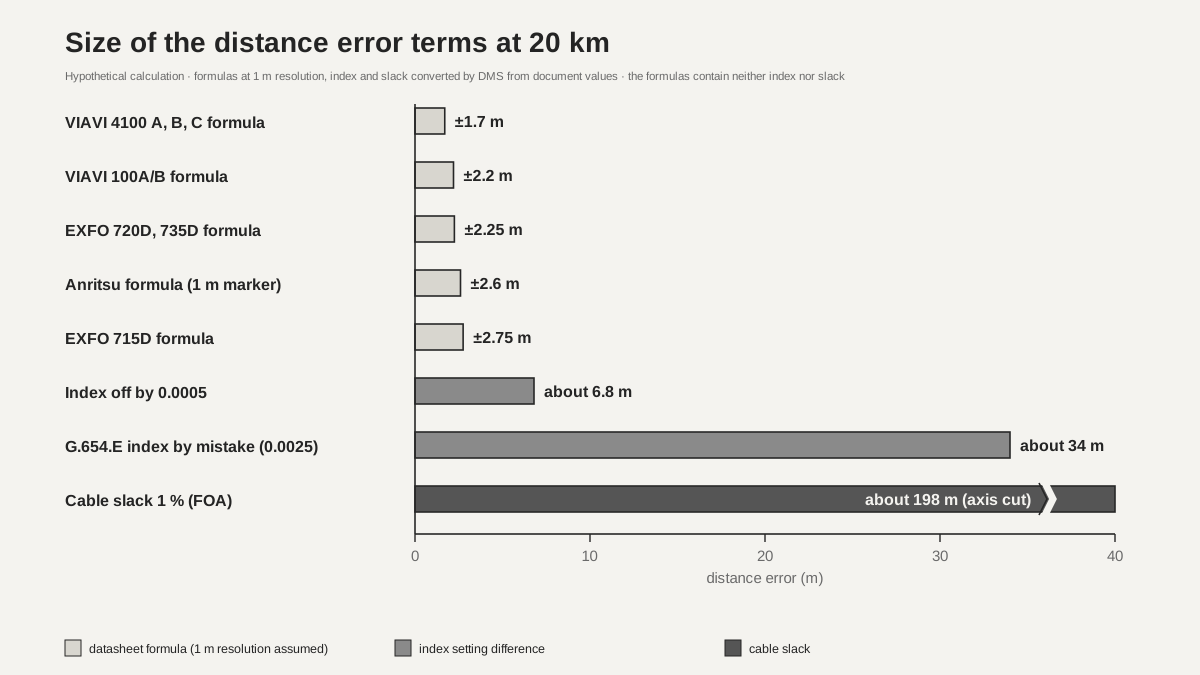
DMS interpretation: to put the formulas on the same line, convert every term to meters and use the same resolution. Under hypothetical conditions of 20 km distance and a 1 m sampling resolution for every instrument, the VIAVI 4100 A, B and C modules come to ±1.7 m, the VIAVI 100A/B and the 4100 MM and QUAD modules to ±2.2 m, the EXFO 720D and 735D to ±2.25 m, the Anritsu to ±2.6 m (assuming a 1 m marker resolution) and the EXFO 715D to ±2.75 m. These figures sit within about 1 m of one another, and that is small next to the index error and the cable slack that the formulas leave out. This comparison is DMS arithmetic on the formulas with an assumed resolution and is not a performance test of any instrument.
 Order for reading an OTDR distance specificationView original
Scroll horizontally to view a wide table.
| Document and edition | Distance accuracy formula | Index uncertainty | Stated conditions |
|---|---|---|---|
| EXFO MaxTester 720D (MAX720D.7EN, marked 2025-08, search-listing date 2025-07-31) | ±(0.75 m + 0.0025 % × distance + sampling resolution) | Excluded (footnote) | 23 ± 2 °C, FC/APC |
| EXFO MaxTester 715D (MAX715D.6EN, marked 2025-08, search-listing date 2025-08-05) | ±(0.75 m + 0.005 % × distance + sampling resolution) | Excluded (footnote) | 23 ± 2 °C, FC/APC |
| EXFO MaxTester 735D (MAX735D.3EN, marked 2026, search-listing date 2026-09-03) | ±(0.75 m + 0.0025 % × distance + sampling resolution) | Excluded (footnote) | 23 ± 2 °C, FC/APC |
| Anritsu MT9085 (catalog MT9085series-E-A-1-(5.00), marked printed 2024-07-30) | ±1 m ±3 × distance × 10⁻⁵ ± marker resolution | Excluded (IOR uncertainty) | No temperature condition next to the formula |
| VIAVI SmartOTDR 100A/B (30176148 907 1222, search-listing date 2022-12-19) | ±1 m ± sampling resolution ±(1.10⁻⁵ × distance) | Excluded (group index uncertainties) | Typical at 25 °C |
| VIAVI 4100 series manual (700MAN201 Rev. 011, marked 2025-11-25) | MM and QUAD ±1 m, A, B and C ±0.5 m, each ± sampling resolution ±10⁻⁵ × distance | Excluded (refractive index calibration error) | No temperature condition next to the formula |
| Fluke OptiFiber Pro (search-listing date 2021-07-08, no revision mark) | On the HDR specification page ±(1 + 0.0005 × distance + 0.5 × resolution) | Wording not found | No unit given, calibration period 1 year |
-
Read the formula as a fixed term, a distance-proportional term and a resolution term
-
Look for the wording that says index uncertainty is left out
-
Do not calculate a formula without a unit in the same table as the others
What do sampling resolution and the sampling point count set?
EXFO Application Note 194 defines sampling resolution as the minimum distance between two consecutive sampling points acquired by the instrument, and says this value defines the ultimate distance accuracy and the fault-finding capability. It adds that, depending on the pulse width and the distance range selected, the value can vary from 4 cm up to a few meters, which is why the number of sampling points must be high. A figure caption in the same note compares fault finding at 5 m resolution and at 15 m resolution.
A datasheet states resolution as a range and not as one value. The EXFO 720D gives 0.04 to 10 m in single-mode and 0.04 to 5 m in multimode with up to 256 000 points, and Anritsu gives 0.05 m to 60 m with up to 150 001 points. The VIAVI SmartOTDR 100A/B lists 4 cm and 256 000 points, and Fluke lists 3 cm to 400 cm with up to 64 000 points, and 3 cm to 2 m with up to 129 000 points for the HDR module. Anritsu says in a footnote that the point density is selected depending on the distance range. None of the other documents reviewed tabulates which resolution applies at which distance range.
DMS calculation: dividing the distance range by the maximum point count gives a feel for the spacing between points. At a 100 km range, 256 000 points is about 0.39 m, Anritsu's 150 001 points about 0.67 m, the Fluke HDR's 129 000 points about 0.78 m and Fluke's 64 000 points about 1.56 m. This assumes all the maximum points are used, and the documents do not say that an instrument actually sets itself that way. Even so, in the same 100 km test an instrument with fewer points moves toward a larger resolution term in the formula.
Resolution is also something you trade against other settings. The VIAVI 4100 manual says that in manual mode the user sets the pulse, the range, the resolution and the acquisition time, and that the resolution item offers High Resolution, which applies the highest resolution, and High Dynamic, which applies the lowest resolution to get the highest dynamic range and is not available in multimode. The Fluke HDR specification page gives the Best resolution setting a test time of 5 to 180 seconds per wavelength. DMS interpretation: do not read the best resolution figure and the largest dynamic range figure on a datasheet as results that come from one and the same test.
Scroll horizontally to view a wide table.
| Document | Sampling resolution | Sampling points | Distance range and notes |
|---|---|---|---|
| EXFO MaxTester 720D | Single-mode 0.04–10 m, multimode 0.04–5 m | Up to 256 000 | 0.1–260 km (single-mode) |
| EXFO MaxTester 735D | 0.04–10 m | Up to 256 000 | 0.1–400 km |
| EXFO MaxTester 715D | 0.04–5 m | Up to 256 000 | 0.1–200 km |
| Anritsu MT9085 | 0.05–60 m | Up to 150 001 | 0.5–300 km (single-mode), point density selected by distance range (footnote) |
| VIAVI SmartOTDR 100A/B | 4 cm | Up to 256 000 | Display range 0.1–260 km |
| VIAVI 4100 series manual | From 4 cm | Up to 256 000 | Display span 3.25 m–400 km (by module) |
| Fluke OptiFiber Pro | 3–400 cm, HDR module 3 cm–2 m | Up to 64 000, HDR module 129 000 | Distance range line not found on the pages read |
-
Resolution is stated as a range that depends on the distance range and the pulse width
-
With the same point count, a longer distance range widens the spacing between points
-
Do not read the best resolution and the largest dynamic range as coming from one test
How far do the index setting and cable slack move a displayed distance?
An OTDR converts the return time of the pulse into distance with the fiber's index of refraction. The FOA page explains that the index is a calibration for the speed of light in the fiber, that the OTDR measures the fiber and not the cable, and that fiber optic cable has about 1 % excess fiber, so the actual cable length is shorter by that amount. The displayed distance is inversely proportional to the index you set (DMS calculation), so a larger index entry shortens the displayed distance.
The VIAVI 4100 manual says the index can be entered from 1.30000 to 1.70000 in steps of 0.00001 or chosen from per-fiber-type values, and Anritsu gives 1.300000 to 1.700000 in steps of 0.000001. The manual's single-mode values for generic G.652 and G.657 fiber are 1.46750 at 1310 nm, 1.46800 from 1360 to 1520 nm and at 1550 nm, and 1.46850 from 1590 to 1650 nm, and G.654.E is 1.46550 in every band. The value changes with wavelength even for the same fiber. The pages read do not say whether the instrument switches the value automatically when you change wavelength, so under DMS interpretation the record should carry the setting for each wavelength.
DMS calculation: on 20 km of fiber, the 0.0005 difference between the 1310 nm value 1.46750 and the 1550 nm value 1.46800 is about 6.8 m (20 000 m × 0.0005 ÷ 1.4675). Picking the G.654.E value 1.46550 instead of the generic G.652 1550 nm value 1.46800 gives a difference of 0.0025, about 34 m. Both are larger than the ±2 m range of the datasheet formulas, and neither is inside those formulas.
Cable length is far larger. Applying the roughly 1 % slack that FOA mentions as it stands, 20 000 m of fiber is about 19 802 m of cable, a difference of 198 m. That 1 % is a general description and the ratio in a real cable differs by construction. FOA suggests measuring a long cable with distance markings, calibrating the index to the cable length and averaging over several fibers. DMS interpretation: an index tuned that way is a calibration for cable length and not the fiber's true index, so write the purpose in the record.
 Size of the distance error terms at 20 kmView original
Scroll horizontally to view a wide table.
| Fiber type (single-mode values in the VIAVI 4100 manual) | 1310 nm | 1360–1520 nm | 1550 nm | 1590–1650 nm |
|---|---|---|---|---|
| Generic G.652 and G.657 | 1.46750 | 1.46800 | 1.46800 | 1.46850 |
| Generic G.653 and G.655 | 1.46750 | 1.46800 | 1.46800 | 1.46850 |
| Generic G.654.E | 1.46550 | 1.46550 | 1.46550 | 1.46550 |
-
Record the index setting and why it was chosen in the test record
-
Check the index again when you change the wavelength or the fiber type
-
Fiber distance and cable distance are different numbers
Are display resolution, cursor resolution and uncertainty the same number?
The three numbers say different things. The VIAVI 4100 manual gives the display resolution and the cursor resolution of distance as 1 cm max each, gives the spacing of measurement points as from 4 cm, and states accuracy separately as the ±0.5 m or ±1 m plus the resolution and distance terms. A distance shown in 1 cm steps does not mean its uncertainty is 1 cm.
The resolution term in the formula is also named differently. EXFO and VIAVI add the sampling resolution, Anritsu adds the marker resolution, and Fluke adds half of the resolution (0.5 × resolution). Where you put the marker decides the event position, so sampling resolution and marker resolution may not be the same value. When the name or the coefficient differs, the size of the term can differ too, so copy the name and the coefficient into the comparison table exactly as read.
Resolution is also not the same as the ability to tell events apart. The FOA page says you cannot see two events closer than the pulse width allows, and the EXFO application note describes a dead zone as the distance over which the detector recovers after a reflection. Even at a 4 cm resolution, a long pulse width can make two close events merge. Anritsu states in its Fresnel and backscatter dead zone columns that the values are at an index of 1.500000. DMS interpretation: that means a dead zone in meters is also tied to an index setting, so when you compare dead zones across documents, check the index condition too.
-
Display resolution is the unit of the number on the screen and not accuracy
-
Copy the resolution term as named (sampling or marker) with its coefficient
-
Check resolution and the ability to separate events (pulse width, dead zone) separately
How do you read this in a hypothetical case?
The situations below are assumed for teaching and are not a real site or a real measurement. The first case is two quotations. Say instrument A's datasheet gives ±(1 m + 1×10⁻⁵ × distance + sampling resolution) and instrument B's gives ±(0.75 m + 0.0025 % × distance + sampling resolution). Put both at 20 km with a 1 m resolution and A is ±2.2 m and B is ±2.25 m, so the distance accuracy formula alone is weak grounds for choosing between them. What separates them is how far the resolution can be reduced, how the index is entered and whether the formula leaves index error out. If instrument C's formula has no unit, do not calculate it and confirm the unit first.
The second case is locating an event. Say the OTDR marks an event at 12 350 m of fiber. With a 0.5 m resolution and the VIAVI 4100 A, B and C formula, the formula uncertainty is about ±1.1 m (0.5 + 0.5 + 10⁻⁵ × 12 350 ≈ 1.12 m). If the index setting is off by 0.0005, about 4.2 m can be added, and if the cable slack is 1 %, the position along the cable is about 12 228 m, about 122 m nearer. DMS interpretation: when you fix a point for opening or excavation, match the fiber distance to the cable length records (closure, manhole) before worrying about the datasheet's ±1 m. The figures and results in this case are all assumptions.
-
Even when the formulas look alike, the resolution setting and the index entry make the larger difference
-
Leave a formula without a unit blank in the comparison table until the unit is confirmed
-
For locating an event, first match the fiber distance to the cable length records
What goes into an equipment selection and a test record?
The selection comparison table should carry, on one line, the model and module name, the document number and edition, the whole distance accuracy formula (with the names and units of the fixed, proportional and resolution terms), the wording that leaves out index uncertainty, the range of sampling resolution and the maximum point count, the display and cursor resolution, the index setting range and entry step, whether the values are typical or guaranteed, and the test temperature condition. Separate the date printed in the document from the search-listing date. The Anritsu brochure read this time is marked printed July 30, 2024, the EXFO 720D and 715D are marked August 2025, the 735D carries a 2026 copyright mark and the VIAVI manual is marked November 25, 2025. No revision mark was found inside the Fluke data sheet, and none of these were assumed to be the values of a model on sale today.
The test record should keep the OTDR model and module, the pulse width, the distance range, the sampling resolution actually used, the index setting and whether it differs by wavelength, the reference length (fiber distance or marked cable length), whether a cable slack correction was applied and on what basis, and the last calibration date. The Fluke data sheet gives a calibration period of 1 year on its HDR specification page, and the specification pages of the other documents read had no such line.
This material is limited to eight manufacturer documents (three EXFO specification sheets and an application note, Anritsu, the VIAVI datasheet and manual, and Fluke) and one FOA page. The text of the standards on OTDR distance calibration was not read, and no manufacturer-stated size for index uncertainty was found. Reading the VIAVI datasheet's 1.10⁻⁵ as 1×10⁻⁵ is an inference that rests on the same company's manual. The values of the models on sale today, the distance test results of an actual instrument and delivery criteria were not confirmed.
-
Carry the whole formula, its units and the index-exclusion wording on the same line as the number
-
In the test record, write the resolution, the index setting and the reference length
-
Do not leave an unchecked item blank; write that it was not confirmed
Checklist
-
Did you find the fixed term, the distance-proportional term, the resolution term and the units in the distance accuracy formula of the OTDR datasheet you use?
-
Did you check whether the datasheet says the formula excludes index (group index) uncertainty?
-
Did you carry the sampling resolution and the index setting used in the test into the test record?
-
Did you write whether the reference length is fiber distance or marked cable length, and whether a slack correction was applied?
-
Did you write the datasheet edition, the document date and the last calibration date in the comparison table and the record?
Review questions
1. In a 20 km link, what is the EXFO 720D formula ±(0.75 m + 0.0025 % × distance + sampling resolution) with a resolution of 1 m?
Answer and explanation: 0.0025 % of 20 000 m is 0.5 m, so 0.75 + 0.5 + 1 = 2.25 m. The 1 m resolution is a hypothetical value DMS entered, and this formula does not contain index uncertainty.
2. At a 100 km distance range, what is the spacing between points if all 256 000 maximum points are used?
Answer and explanation: 100 000 m divided by 256 000 is about 0.39 m. This assumes all the maximum points are used, and the datasheet does not say that the instrument actually sets itself that way.
3. You measure 20 km of fiber at 1550 nm but enter the G.654.E value 1.46550 instead of the generic G.652 value 1.46800. About how many meters is the displayed distance off?
Answer and explanation: 20 000 m × 0.0025 ÷ 1.4680 is about 34 m, and because the index was entered smaller, the displayed distance runs longer. This error is not inside the datasheet distance formula, so it can only be checked if the index setting is written in the test record.
Sources
-
EXFO: MaxTester 720D specification sheet · MAX720D.7EN, marked 2025-08, search-listing date 2025-07-31, specifications on PDF page 8
-
EXFO: MaxTester 715D specification sheet · MAX715D.6EN, marked 2025-08, search-listing date 2025-08-05, specifications on PDF page 8
-
EXFO: MaxTester 735D specification sheet · MAX735D.3EN, marked 2026, search-listing date 2026-09-03, specifications on PDF page 9
-
Anritsu: ACCESS Master MT9085 series brochure · MT9085series-E-A-1-(5.00), marked printed 2024-07-30, specifications on PDF pages 14 to 15
-
VIAVI: SmartOTDR 100A/B series data sheet · 30176148 907 1222, distributor copy, search-listing date 2022-12-19, specifications and footnotes on page 3
-
VIAVI: OTDR 4100 series modules user manual · 700MAN201 Rev. 011, marked 2025-11-25, printed pages 40, 45 to 46 and 96 (PDF pages 56, 61 to 62 and 112)
-
Fluke Networks: OptiFiber Pro data sheet · search-listing date 2021-07-08, no revision mark inside, PDF pages 24 and 26 to 28
-
EXFO: Application Note 194, OTDR fundamentals · APNOTE194.2AN, 2017, dead zones and sampling resolution on pages 3 to 4
-
FOA: OTDR · no date shown (copyright 2008 to 2024), index of refraction and pulse width sections