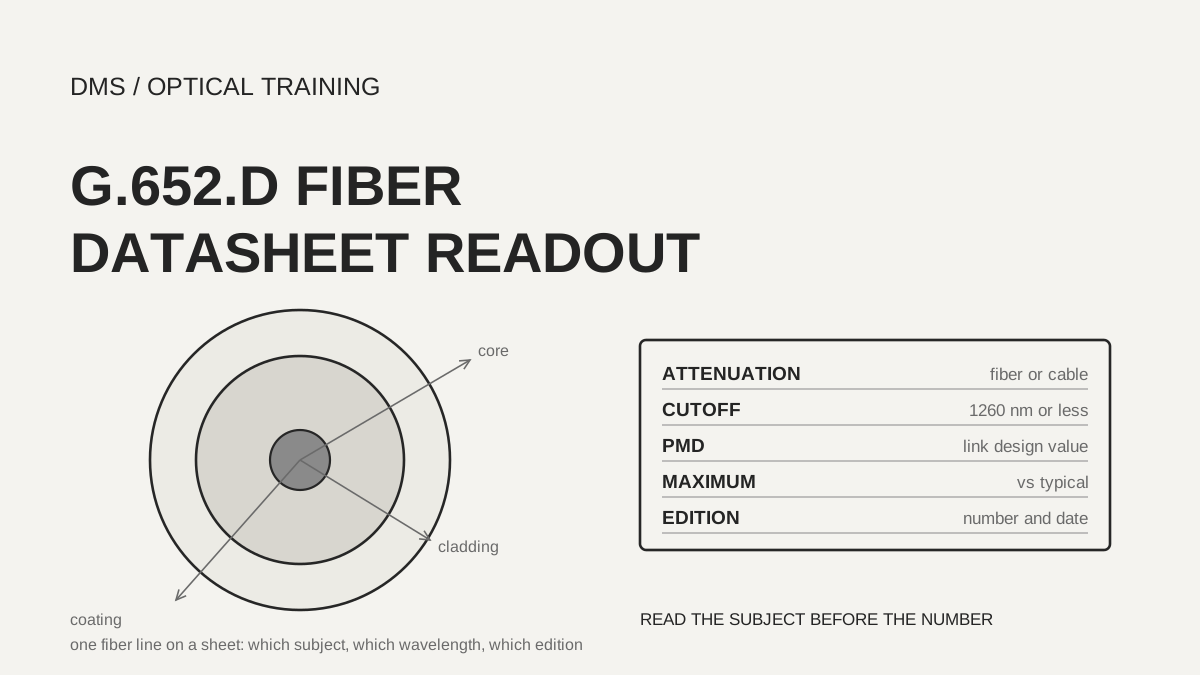
An attenuation line on a G.652.D datasheet can only be moved into a design after you know whether it describes the fiber or the cable, and whether it is a maximum or a typical value. In the documents reviewed, the maximum attenuation at 1550 nm was 0.30 dB/km in the ITU-T G.652 cable limit, 0.21 dB/km on the Prysmian fiber sheet and 0.18 dB/km on the Corning fiber sheet, and these three figures differ in subject and basis. PMD is also split in most sheets into an individual fiber maximum and a link design value (PMDQ), so confirm which length and probability each line refers to before multiplying anything.
As of November 10, 2026, based on the documents listed under Sources.
Learning objectives
-
Read an attenuation coefficient line in four parts: subject (fiber or cable), wavelength, maximum or typical value, and document edition.
-
Read the cable cutoff wavelength line (1260 nm or less) and the PMD link design value line against the definitions in the text of ITU-T G.652.
-
When moving sheet values into a link loss budget or a PMD calculation, record assumed numbers separately from the numbers the sheet prints.
What does one attenuation coefficient line describe?
ITU-T G.652 (edition of August 2024, approved on August 29, 2024, in force) gives the cable attenuation coefficient of G.652.D in Table 2 as three lines: a maximum of 0.40 dB/km from 1310 nm to 1625 nm, a maximum of 0.40 dB/km at 1383 nm after hydrogen ageing, and a maximum of 0.30 dB/km from 1530 to 1565 nm. This is a cable limit, and a note states that it should not be applied to short cables such as jumper, indoor and drop cables. Another note says the wavelength region can be extended down to 1260 nm by adding 0.07 dB/km of induced Rayleigh scattering loss to the 1310 nm value.
Manufacturer sheets print lower values, but they mix subjects. The Prysmian fiber sheet (issued August 2024) gives 0.35 dB/km at 1310 nm, 0.21 at 1550 nm and 0.23 at 1625 nm, while the cable sheet of the same company gives the maximum attenuation of the cable as 0.36 dB/km at 1310 nm and 0.22 dB/km at 1550 nm. Corning SMF-28 Ultra (July 2025) gives 0.32, 0.18 and 0.20 dB/km and states that other attenuation values are available on request. The subject column in the table below is the one to read first.
Scroll horizontally to view a wide table.
| Document | Subject | 1310 nm | 1550 nm | 1625 nm |
|---|---|---|---|---|
| ITU-T G.652 Table 2 (August 2024) | Cable limit | 0.40 (1310 to 1625 nm throughout) | 0.30 (1530 to 1565 nm) | 0.40 |
| Prysmian fiber sheet (August 2024) | Fiber | 0.35 | 0.21 | 0.23 |
| Prysmian 500 µm sheet (November 2023) | Fiber | 0.4 | 0.25 | 0.3 |
| Prysmian cable sheet (no issue date printed) | Cable | 0.36 | 0.22 | not printed |
| Corning SMF-28 Ultra (July 2025) | Fiber | 0.32 | 0.18 | 0.20 |
| Distributor Biakom sheet (no issue date or maker printed) | Loose tube cable maximum (typical) | 0.36 (0.32) | 0.24 (0.19) | 0.26 (0.22) |
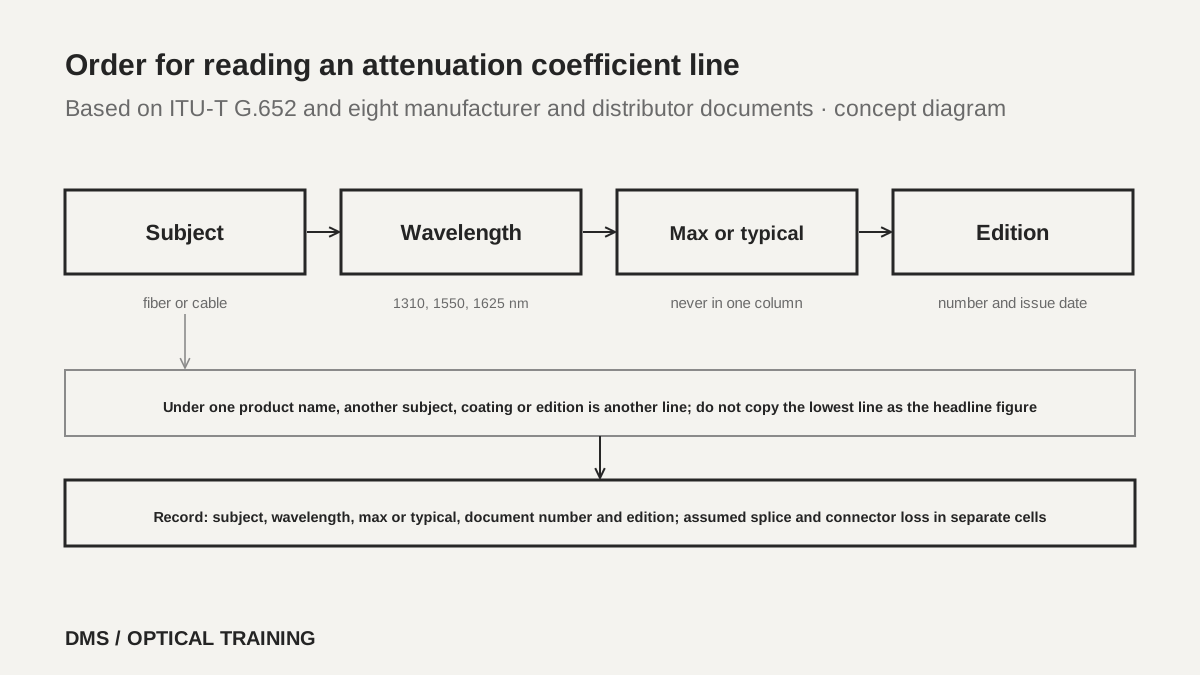 Order for reading an attenuation coefficient lineView original
-
Check first whether the subject column is fiber or cable
-
Do not compare maximum and typical values in the same column
-
Check the note that the 1383 nm value applies after hydrogen ageing
Placing the two Prysmian documents side by side, the cable value is 0.01 dB/km higher than the fiber value at both 1310 nm and 1550 nm. The documents do not say that cabling causes this, and it was not confirmed that the two documents are an edition pair, so the difference is read only as a DMS comparison. The distributor document prints typical and maximum values in the same table and separates loose tube cables from tight buffered cables. For tight buffered cable the 1550 nm maximum is 0.40 dB/km, higher than for loose tube. This shows that the limit can change with the cable type even under the same fiber name.
Does a different coating or sheet type change the attenuation limit?
The Prysmian sheet for 500 µm coating (November 2023) prints attenuation of 0.4 dB/km at 1310 nm, 0.4 at 1383 nm, 0.25 at 1550 nm and 0.3 at 1625 nm. The 242 µm sheet of the same company (August 2024) prints 0.35, 0.35, 0.21 and 0.23 dB/km. The two sheets carry the same mode field diameter, cutoff wavelength and PMD lines, and only the attenuation lines are higher. The sheet gives no reason, so the coating diameter is not named as the cause. Only the practical point is recorded: even under one product name, read the sheet for each coating type separately.
The Corning sheet shows a standard 242 µm coating and a reduced 200 µm coating together, and it does not state separately whether one attenuation table covers both. When one product name has more than one form, write the coating diameter, the color (colored or not) and the attenuation grade on the order. Also read the lines about the shape of the attenuation curve. Corning states that attenuation in 1285 to 1330 nm does not exceed the 1310 nm value by more than 0.03 dB/km and in 1525 to 1575 nm does not exceed the 1550 nm value by more than 0.02 dB/km, and Prysmian adds 0.04 dB/km for the 1460 to 1625 nm region.
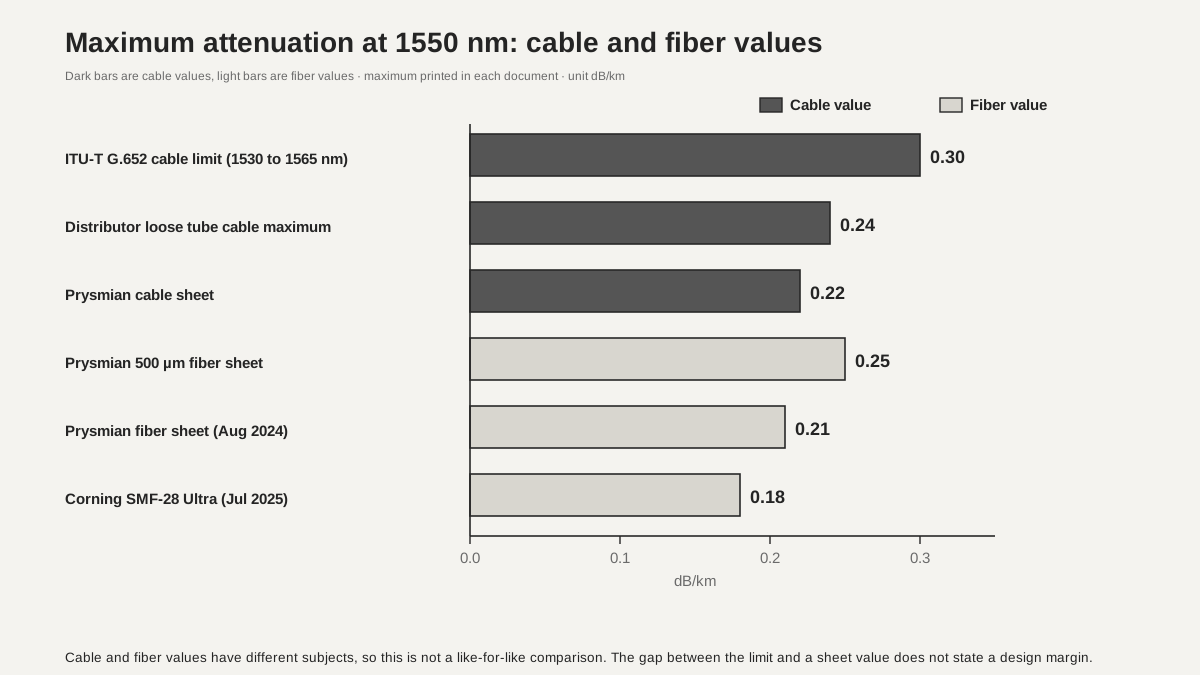 Maximum attenuation at 1550 nm comparedView original
-
In the bars, dark means a cable value and light means a fiber value
-
Cable and fiber values may sit on one axis, but they are not a like-for-like comparison
What does a cable cutoff wavelength of 1260 nm or less guarantee?
Clause 6.5 of ITU-T G.652 distinguishes the cable cut-off wavelength (λcc) from the fibre cut-off wavelength (λc). It says that λcc is in general smaller than λc, but that a general quantitative relationship cannot easily be established. It states that ensuring single-mode transmission in the minimum cable length between joints at the minimum operating wavelength is paramount, and that this may be done by recommending a maximum cable cut-off wavelength of 1260 nm for a cabled single-mode fibre. The G.652.D line in Table 2 also gives a maximum cable cut-off wavelength of 1260 nm.
Note 2 says that cut-off wavelength intrinsically contains length and bending dependence. If the link has a unique deployment condition, for example a piece shorter than 22 m without specific bending, you should ensure that the cut-off under that condition has negligible influence. Manufacturer documents print this line as follows. The Prysmian fiber sheet says 'Cable Cutoff Wavelength (λccf) ≤ 1260 nm', and the cable sheet says 'λCC ≤ 1260 *' with a footnote that it is a guaranteed value according to the ITU-T (ASTM G650) method. Corning says 'λcc ≤ 1260 nm'. All three print the same number, so the field check is under which test conditions and length the value was obtained. The text of the test method (G.650.1 and others) was not read this time.
In field training, use this line as follows. 1260 nm is the lower end of the extended wavelength range (1260 to 1625 nm) that G.652.D may use, so DMS reads a link that uses only longer wavelengths as having margin here. For stretches with many short pieces or coiled jumpers, do not rely on one sheet number and record the deployment condition that ITU note 2 describes.
How does a PMD link design value differ from the maximum for an individual fiber?
Clause 7.2 of ITU-T G.652 says that cabled-fibre PMD shall be specified on a statistical basis rather than for an individual fibre, and that the manufacturer shall supply a PMD link design value, PMDQ. PMDQ is a statistical upper bound on the PMD coefficient of M concatenated cable sections, set so that the probability of exceeding it is a small level Q. For G.652.D, Table 2 gives M as 20 cables, Q as 0.01 % and a maximum PMDQ of 0.20 ps/√km. It also says that measurements and specifications on uncabled fibre are necessary but not sufficient to ensure the cabled specification.
Manufacturer sheets print link design values well below this limit. The Prysmian fiber sheet gives a PMD link design value of 0.06 ps/√km (IEC 60794-3 Ed 3, Q 0.01 %) and a maximum individual fiber of 0.1 ps/√km, while the cable sheet gives a cabled PMD coefficient of 0.2 ps/√km and a PMDQ of 0.06 ps/√km (Q 0.01 %, N 20). Corning gives a PMD link design value of 0.04 ps/√km and a maximum individual fiber PMD of 0.1 ps/√km, and adds that the link design value is a statistical upper limit for the PMD of concatenated lengths of fiber and that individual PMD values may change when the fiber is cabled.
Scroll horizontally to view a wide table.
| Document | PMD link design value | Individual fiber maximum | Basis printed |
|---|---|---|---|
| ITU-T G.652 Table 2 | 0.20 (maximum PMDQ) | not specified | M 20 cables, Q 0.01 % |
| Prysmian fiber sheet (August 2024) | 0.06 | 0.1 | IEC 60794-3 Ed 3, Q 0.01 % |
| Prysmian cable sheet | 0.06 (cabled PMD coefficient 0.2) | not printed | Q 0.01 %, N 20 |
| Corning (July 2025) | 0.04 | 0.1 | ITU-T G.650-2 Appendix IV, m 20, Q 0.01 % |
| Distributor Biakom sheet | 0.1 (fiber PMD link value) | 0.15 | no basis printed |
The line to be most careful with in this table is the distributor document. It does not say for what probability and number of sections the link value 0.1 and the individual maximum 0.15 apply. The unit is also printed in the original as 'ps/Ökm', which DMS read as ps/√km, and neither the manufacturer nor the issue date is printed. A document like this is not used as design evidence and is kept only as a comparison example.
What do you get by multiplying a PMD value by the link length?
Appendix I of ITU-T G.652 explains that the DGD (differential group delay) of a link varies randomly with time and wavelength and follows a Maxwell distribution whose single parameter is the product of the link PMD coefficient and the square root of the link length. That is where the calculation of PMD coefficient times the square root of length comes from. The product itself is a DMS calculation fitted to this explanation. For a 64 km link, the Prysmian value of 0.06 ps/√km gives 0.06 × 8 = 0.48 ps, and the ITU limit of 0.20 ps/√km gives 1.6 ps.
Do not read the product as a maximum delay. Table I.2 of ITU-T G.652 lists the PMDQ and the link length with the implied maximum DGD separately. At 0.20 ps/√km it gives 7.0 ps for 80 km at 40 Gbit/s and 19.0 ps for 3000 km at 10 Gbit/s, and at 0.10 ps/√km it gives 5.0 ps for 400 km at 40 Gbit/s. The table does not print a multiplication formula, so DMS did not confirm how the coefficient times the square root of length connects to the maximum DGD in the table.
Note 3 says the PMDQ specification should not be applied to short cables such as jumper, indoor and drop cables, and note 1 says it is required only for cables used in systems that specify a maximum DGD. DMS reads this as meaning that in short access segments the PMD calculation is often not the deciding factor, and that part is a DMS interpretation.
Which lines change when a product edition changes?
Two pairs in the documents read allow an edition comparison. For Corning SMF-28 Ultra, the edition of November 2014 (superseding July 2014) and the edition of July 2025 (superseding February 2024) were read. The five maximum attenuation lines and the PMD link design value of 0.04 are the same. The maximum chromatic dispersion at 1625 nm changed from 22.0 to 23.7 ps/(nm·km), and the basis printed on the PMD line changed from 'IEC 60794-3: 2001, Section 5.5, Method 1, m 20, Q 0.01 %' to 'ITU-T G.650-2 Appendix IV, August 2015'. The new 23.7 is the same number as the 1625 nm maximum chromatic dispersion in Table 2 of ITU-T G.652 (August 2024). Corning did not state a reason for the revision.
For the 242 µm fiber sheet of Prysmian, the edition of November 2023 (superseding August 2010) and the edition of August 2024 (superseding November 2023) have identical attenuation, mode field diameter, cutoff wavelength and PMD lines. A new edition does not always mean new numbers, so recording that a comparison found them the same is also a useful check. On the other hand, the Prysmian fiber sheet prints the mode field diameter at 1310 nm as 9.0 ± 0.4 µm and the cable sheet prints 9.2 ± 0.4 µm, which differ. Do not pick one; record both values by document.
Which numbers go into the link loss budget?
Appendix I.1 of ITU-T G.652 gives the mean attenuation of a link as the sum of the mean attenuation coefficient of the cables times the link length, the mean splice loss times the number of splices, and the mean connector loss times the number of line connectors. The loss of equipment connectors is not in this equation, and the appendix says to allocate a suitable margin for future modifications of cable configurations, ageing and temperature variation. Table I.1 gives representative values for concatenated optical fibre links: 0.5 dB/km for 1260 to 1360 nm, 0.275 dB/km for 1530 to 1565 nm and 0.35 dB/km for 1565 to 1625 nm. These representative values are not the same kind of number as manufacturer maximums, so do not mix them in one column.
Take a hypothetical training case of a 20 km link at 1550 nm. If you assume 0.1 dB average for 8 fusion splices and 0.3 dB average for 2 connectors, the splice and connector loss together is 1.4 dB. These two values are assumptions for the exercise and are not numbers taken from a sheet. With the Corning maximum of 0.18 as the attenuation coefficient, the budget is 3.6 + 1.4 = 5.0 dB. With the Prysmian cable maximum of 0.22 it is 4.4 + 1.4 = 5.8 dB, with the ITU Table I.1 representative link value of 0.275 it is 5.5 + 1.4 = 6.9 dB, and with the ITU cable limit of 0.30 it is 6.0 + 1.4 = 7.4 dB. The same link differs by almost 2.4 dB depending on which line you pick. This case is an exercise calculated from printed figures and is not a test of a real site or product.
The limits of this material are clear as well. The documents read are ITU-T G.652 and manufacturer and distributor sheets, and the text of IEC 60793-2-50, IEC 60794-3, ITU-T G.650.1 and G.650.2 was not read. In places it could not be told whether a sheet value is a guaranteed or a representative value, and agreement with currently sold products, real link tests and delivery criteria were not confirmed.
-
Record an attenuation coefficient together with its subject, wavelength, maximum or typical status and edition
-
Record the PMD link design value and the individual fiber maximum on separate lines, with the probability Q and the number of sections M
-
Do not mix assumed splice and connector losses with numbers the sheet prints
Checklist
-
For the fiber datasheet in use, did you confirm whether the attenuation line is a fiber or a cable value and a maximum or a typical value, and record the document number and issue date?
-
Did you avoid mixing numbers from a sheet of another coating diameter or another edition under the same product name?
-
Did you confirm the cable cutoff wavelength line and its test conditions, and record a separate note for any stretch that uses pieces shorter than 22 m?
-
Did you separate the PMD link design value from the individual fiber maximum and write the probability Q and the number of sections M (the printed basis)?
-
In the link loss calculation, did you write sheet numbers, assumed splice loss, assumed connector loss and margin in separate cells?
Review questions
1. Using the PMD link design value of 0.06 ps/√km from the Prysmian fiber sheet on a 64 km link, what is the calculated PMD value?
Answer and explanation: 0.06 × √64 = 0.06 × 8 = 0.48 ps. This product is a DMS calculation fitted to the explanation in Appendix I of ITU-T G.652 (the parameter of the DGD distribution is the PMD coefficient times the square root of length), and it is not a value the document prints as a maximum delay.
2. Multiply the Prysmian fiber sheet value of 0.21 dB/km at 1550 nm and the cable sheet value of 0.22 dB/km by a 12 km link. What is the difference, and which is used for cable design?
Answer and explanation: 12 × 0.21 = 2.52 dB and 12 × 0.22 = 2.64 dB, so the difference is 0.12 dB. The line that applies to cable is the 0.22 of the cable sheet. It was not confirmed that the two documents are an edition pair, so the difference is not attributed to cabling.
3. Which lines changed between the November 2014 and July 2025 editions of Corning SMF-28 Ultra?
Answer and explanation: The maximum chromatic dispersion at 1625 nm changed from 22.0 to 23.7 ps/(nm·km), and the basis printed on the PMD line changed from IEC 60794-3:2001 to ITU-T G.650-2 Appendix IV (August 2015). The maximum attenuation values and the PMD link design value of 0.04 are the same. The sheet does not give the reason for the revision.
Sources
-
ITU-T: Recommendation G.652 (08/2024) Characteristics of a single-mode optical fibre and cable · clause 6.5 cut-off wavelength, clauses 7.1 and 7.2 (PDF page 14), Table 2 (PDF page 16), Appendix I Tables I.1 and I.2 (PDF page 19)
-
Prysmian: Enhanced Single-Mode Fibre ITU-T G.652.D (issued August 2024) · pages 1 to 2
-
Prysmian: Enhanced Single-Mode Fibre ITU-T G.652.D (issued November 2023) · pages 1 to 2
-
Prysmian: Enhanced Single-Mode Fibre with 500 µm coating (issued November 2023) · pages 1 to 2
-
Prysmian: G652D cable datasheet (ficha técnica) · no issue date printed, copyright 2015 in the footer, pages 1 to 2
-
Corning: SMF-28 Ultra Optical Fiber PI1424 (issued July 2025) · pages 1 to 2
-
Corning: SMF-28 Ultra Optical Fiber PI1424 (issued November 2014, distributor copy) · page 1
-
Biakom: Single Mode Fiber G.652.D sheet · distributor document, no maker or issue date printed, pages 1 to 2