The insertion loss on an optical connector datasheet can only be compared once you know whether it is a typical, mean, maximum or against-master value, return loss is printed with different signs and units from one document to the next, and a mating cycle count means little unless the allowed loss change sits on the same line. In the Senko, Corning, AFL and Fischer single-mode UPC lines and the ITU-T L.404 grade Bf line that were read, one mated pair was printed with a typical or mean insertion loss of 0.05 dB to 0.35 dB and a maximum of 0.15 dB to 0.55 dB, and two datasheets for the same product family disagreed with each other. A link loss budget should record which value of which document was used.
As of November 12, 2026, based on the documents listed under Sources.
Learning objectives
-
Split an insertion loss line into the kind of value (typical, mean, maximum) and the mating condition (master reference or random mating).
-
Tell reflectance and return loss apart by sign, mating state (mated or unmated) and unit, and write them in one direction.
-
Read the mating cycle count together with the allowed loss change, and when two datasheets of one product family print different numbers, record both with the document number and date.
What conditions are attached to an insertion loss line?
An insertion loss line is not a single number but a combination of the kind of value and the mating condition. The Senko interconnect catalogue (no document date printed, page code E-3.3) prints two sets of values for the same connector. One is the loss against a master connector (IL against master) and the other is the loss when two randomly chosen connectors are mated (IL random mating). Premium SM prints a 0.08 dB average and 0.20 dB maximum against a master, and a 0.12 dB mean and 0.25 dB maximum for random mating. Standard SM prints 0.12 dB and 0.30 dB against a master, and 0.25 dB and 0.50 dB for random mating. The same connector reads lower against a master and higher against a random partner. A connector in the field meets a partner that is not a master, so the random mating line is the closer starting point for a budget, which is a DMS reading.
Scroll horizontally to view a wide table.
| Product (Senko catalogue) | Against master, average / maximum (dB) | Random mating, mean / maximum (dB) | IEC grade printed by Senko |
|---|---|---|---|
| Premium Low Loss SM | 0.05 / 0.15 | 0.07 / 0.15 | Grade A, recommendation |
| Premium SM | 0.08 / 0.20 | 0.12 / 0.25 | Grade B |
| Premium SM APC | 0.10 / 0.25 | 0.14 / 0.30 | none printed |
| Standard SM | 0.12 / 0.30 | 0.25 / 0.50 | Grade C |
The Senko Micro LC datasheet (DS-LC-000005 Rev A) puts its condition in a note under the table. The typical single-mode UPC insertion loss is 0.05 dB for the low loss type and 0.08 dB for the standard type, with maximums of 0.15 dB and 0.20 dB, and the note says the values are based on a master grade jumper to low loss random mating test. If only the numbers are copied out of the table, that condition is lost, so the note is copied with them as one line.
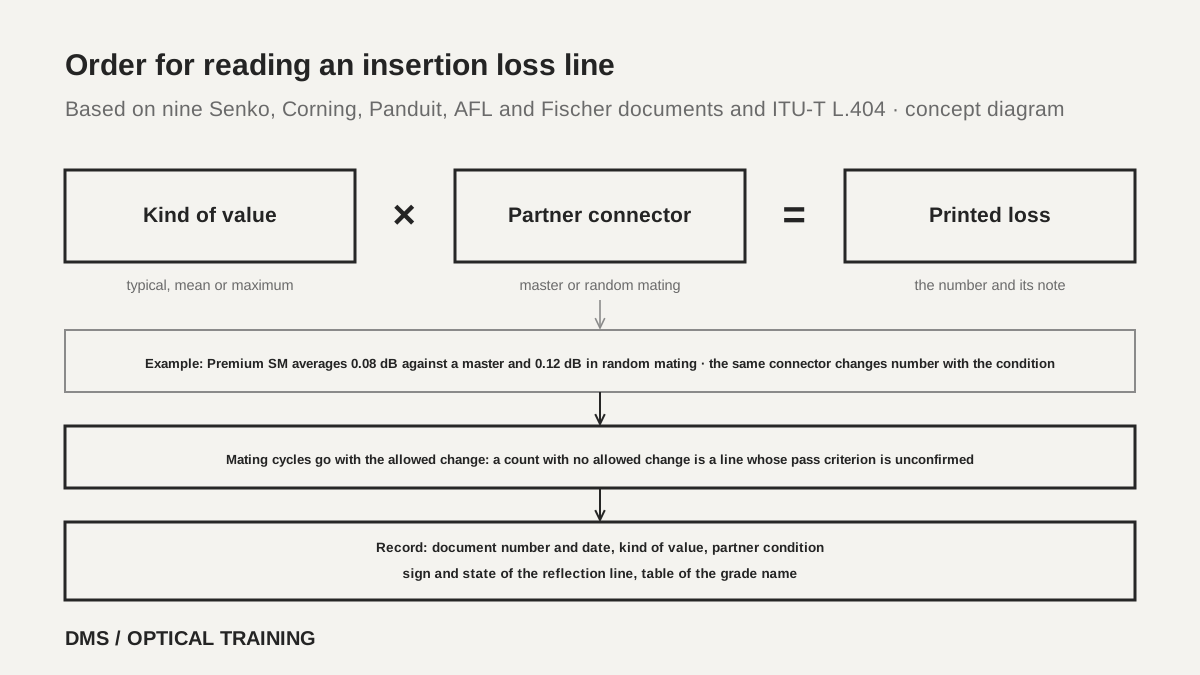 Order for reading an insertion loss lineView original
-
Write the kind of value (typical, mean, maximum) before copying the number
-
Check whether the datasheet says the partner is a master or a random connector
-
Put the document number and date on the same line
What if datasheets of one product family print different numbers?
Different documents can print different numbers under the same product family name. The North American Corning UniCam high-performance connector sheet (0252, revision date 2015-01-06) prints single-mode LC and SC UPC at 0.2 dB typical and 0.5 dB maximum insertion loss with reflectance of -55 dB or lower, and gives durability as a 0.2 dB change over 500 rematings per FOTP-21. The EMEA sheet (0250, revision date 2018-01-22) prints the same UPC at 0.3 dB typical, 0.5 dB maximum and reflectance of -50 dB or lower, prints APC separately at 0.4 dB typical, 0.75 dB maximum and reflectance of -55 dB or lower, and gives durability as 0.2 dB with no cycle count. It is clear that the two documents come from different years and regions, but the documents do not say why the numbers differ. They also name different installation kits, the high-performance tool kit in one and tool kit 2 in the other.
Panduit shows two values inside one document. The SC OptiCam specification sheet (FBSP17-WW-ENG, July 2024) states in its text an average insertion loss of 0.3 dB per mated pair, while the selection table prints 0.03 dB for the same item. The LC OptiCam document prints 0.3 dB in its table and adds a footnote that the values were calculated from tests with precision launch jumper assemblies per TIA/EIA-FOTP-171. The 0.03 in the SC sheet looks like a typing error, but the document does not correct it, so DMS does not choose and records both values.
The AFL optical connectivity catalogue mixes pages of several revisions in one book. The connector specification table (PP-2-00047 Rev 4, printed date 8.10.2026) prints a single-mode LC ultra polish at 0.15 dB typical and 0.3 dB maximum, while the DENALI LC patch cord page (PP-2-00415 Rev 1, printed date 7.28.2026) prints 0.10 dB typical and 0.30 dB maximum for single-mode. The product lines differ, so this is not a contradiction, but carrying one number for the whole catalogue would be wrong.
Scroll horizontally to view a wide table.
| Document | Single-mode UPC typical or average (dB) | Maximum (dB) | Reflection line | Mating line |
|---|---|---|---|---|
| Corning UniCam 0252 (2015-01-06) | 0.2 | 0.5 | reflectance -55 dB or lower | 0.2 dB change, 500 cycles |
| Corning UniCam 0250 (2018-01-22) | 0.3 | 0.5 | reflectance -50 dB or lower | 0.2 dB, no cycle count |
| Panduit SC OptiCam (July 2024) | 0.3 (text) or 0.03 (table) | none printed; 0.75 on the mating test line | return loss above 50 dB | 500 cycles |
| AFL specification table, LC ultra | 0.15 | 0.3 | minimum -55 dB | 500 cycles |
| AFL DENALI LC patch cord | 0.10 | 0.30 | typical -55 dB | 500 cycles |
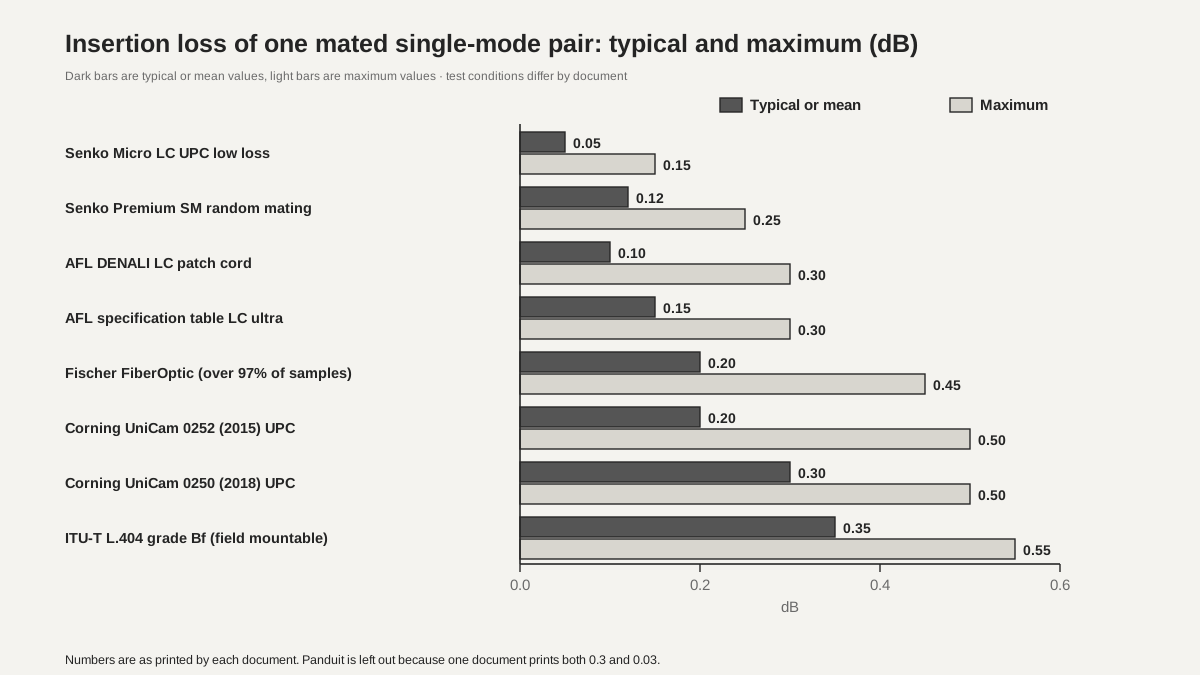 Typical and maximum insertion loss of one mated single-mode pairView original
-
Dark bars are the typical or average values printed, light bars are the maximum values
-
Test conditions differ by document, so this is not a like-for-like performance comparison
How are return loss values signed and defined?
The reflection line prints the same phenomenon in three shapes with different signs and units. Corning prints reflectance as a negative number with an inequality, such as -55 dB or lower. Panduit prints return loss as a positive number, such as above 50 dB. AFL prints a negative number such as -55 dB in the Minimum column of its Return Loss row. With the sign removed, Corning's -55 dB or lower points the same way as a return loss of 55 dB or more, so it is 5 dB stricter than Panduit's above 50 dB. The negative Return Loss column in the AFL table looks like a notation habit, but the document does not explain it, so it is marked as a DMS reading. Signs are handled the same way as in the reflectance and ORL test report lesson.
The second point is the split between typical and minimum values. The AFL specification table (PP-2-00045 Rev 6, printed date 11.2.2020) prints single-mode LC and SC return loss as typical -60 dB with minimum -55 dB for ultra polish and typical -70 dB with minimum -65 dB for angled polish, and a footnote says the typical values are based on equal quality connectors. The minimum line is the guarantee and the typical line is a reference. Fischer and ITU-T also split the mating state. The Fischer FiberOptic specification (version 4.9, May 2026) prints single-mode UPC at 50 dB or more and APC at 70 dB or more mated and 50 dB or more unmated, and ITU-T L.404 grade 1 is 60 dB or more mated and 55 dB or more unmated. A separate unmated APC value means the datasheet also sets the reflection of a port that is left open.
Scroll horizontally to view a wide table.
| Document | Printed form | Single-mode value | What to note |
|---|---|---|---|
| Corning UniCam 0252 | Reflectance | UPC -55 dB or lower, SPC -40 dB or lower | negative with inequality |
| Corning UniCam 0250 | Reflectance | UPC -50 dB or lower, APC -55 dB or lower | same family, different UPC number |
| Panduit OptiCam | Return loss | above 50 dB | positive; multimode above 20 dB |
| AFL specification table | Return Loss | minimum -55 or -65 dB, typical -60 or -70 dB | typical and minimum split |
| Senko Micro LC | Typical Return Loss | UPC 55 dB or more, APC 65 dB or more | typical only |
| Fischer FiberOptic | Return loss | UPC 50 dB or more, APC 70 dB or more mated and 50 dB or more unmated | mated and unmated split |
| ITU-T L.404 Table 8-2 | Grades 1 to 4 | 60 (mated) or 55 (unmated), 45, 35, 26 dB or more | printed as grade names |
How do I read mating cycles together with the allowed loss change?
A line with only a mating cycle count is half a test. Next to the count there must be how many dB of change is still a pass and by which test method. The Senko catalogue prints less than 0.1 dB typical change after 500 matings in its connector lines, and the Micro LC datasheet prints less than 0.2 dB for the same 500 matings. Corning 0252 prints a 0.2 dB change over 500 rematings per FOTP-21 and so names the method, while 0250 has only 0.2 dB and no count. Panduit prints, after 500 mate and unmate cycles, a maximum insertion loss of 0.75 dB, a minimum return loss of 20 dB and an additional loss below 0.1 dB. The document does not say whether the 20 dB also applies to single-mode, so it is not read as the same value as the single-mode return loss of above 50 dB.
AFL prints mating cycles as 500 for LC, SC, ST and FC and 200 for MTP and MT-RJ, but the allowed loss change and test method are not in the same table. Such a line lets you compare the size of the count but not confirm the pass criterion. Fischer prints mating durability as 1000 cycles (IEC 61300-2-2), recommends cleaning every 50 cycles, and sets the change during and after the test at 0.2 dB. ITU-T L.404 also says plugs and adaptors are cleaned according to the manufacturers' instructions before each test. It is safer to read a mating cycle count as a number that assumes cleaning.
The adapter side has its own numbers. The zirconia sleeves for ST, SC, FC, LC and MU in the Senko catalogue print a maximum insertion loss of 0.5 dB with 0.1 dB typical or better, and a deviation of less than 0.02 dB after 1000 matings, and the note says these hold when SENKO recommended procedures are followed. The 500 cycles on the connector line and the 1000 cycles on the sleeve line concern different parts and are not mixed in one cell.
Scroll horizontally to view a wide table.
| Document | Mating cycles | Allowed change or pass criterion | Note |
|---|---|---|---|
| Senko catalogue connectors | 500 matings | less than 0.1 dB typical change | no document date printed |
| Senko Micro LC | 500 matings | less than 0.2 dB typical change | Rev A |
| Senko zirconia sleeves | 1000 matings | deviation less than 0.02 dB | adapter part, under Senko recommended procedures |
| Corning UniCam 0252 | 500 rematings | 0.2 dB change | FOTP-21 |
| Corning UniCam 0250 | not printed | 0.2 dB | no count |
| Panduit OptiCam | 500 cycles | maximum 0.75 dB, minimum return loss 20 dB, additional loss below 0.1 dB | single-mode applicability not printed |
| AFL specification table | 500 for LC, SC, ST and FC, 200 for MTP and MT-RJ | not printed | no test method printed |
| Fischer FiberOptic | 1000 cycles | 0.2 dB during and after the test | cleaning every 50 cycles recommended |
How do I match a grade name and a standard number?
The same grade name can carry different numbers when the table is different. The Senko catalogue says it classifies its connectors to the IEC 61753-1 random mating grades A, B and C and copies Grade B as a 0.12 dB mean and 0.25 dB maximum for more than 97% of samples, and Grade C as 0.25 dB and 0.50 dB. Grade A is a 0.07 dB mean and 0.15 dB maximum, and the catalogue says that specification is not finalized and the values are a recommendation. By contrast, Table 8-1 of ITU-T L.404 (August 2017) for field mountable connectors sets grade Bf at a 0.35 dB mean and 0.55 dB maximum and grade Cf at a 0.4 dB mean and 0.75 dB maximum, and leaves grade Af reserved for future application. That table refers to random mating between two randomly selected connectors of the same type, with measurement near 1310 nm, 1550 nm and 1625 nm and single-mode fibre whose mode field diameter is 8.2 µm to 9.6 µm at 1310 nm.
So when a datasheet only says Grade B, first check which table that B comes from. The IEC 61753-1 text was not read, and the A, B and C numbers above are the values Senko copied into its catalogue. The phrase that the maximum applies to more than 97% of samples can be read to mean that the remaining samples may exceed the maximum, which is a DMS reading.
Scroll horizontally to view a wide table.
| Table | Grade | Mean (dB or less) | Maximum (dB or less, more than 97% of samples) |
|---|---|---|---|
| IEC 61753-1 as copied by Senko | A (recommendation) | 0.07 | 0.15 |
| IEC 61753-1 as copied by Senko | B | 0.12 | 0.25 |
| IEC 61753-1 as copied by Senko | C | 0.25 | 0.50 |
| ITU-T L.404 Table 8-1 (field mountable) | Bf | 0.35 | 0.55 |
| ITU-T L.404 Table 8-1 (field mountable) | Cf | 0.40 | 0.75 |
Which value goes into a link loss budget?
The case used here is a hypothetical teaching calculation and not a test of a real site or product. Assume a single-mode link with four mated pairs, each pair being two connectors joined in an adapter, and multiply each document's per-pair value by 4. Multiplying the typical or mean value gives an expected loss and multiplying the maximum gives a conservative upper plan. Adding maximum values is a planning convention and not a rule of any standard, and the record should say so.
Scroll horizontally to view a wide table.
| Document | One pair typical or mean (dB) | Four pairs (dB) | One pair maximum (dB) | Four pairs (dB) |
|---|---|---|---|---|
| Senko Premium SM, random mating | 0.12 | 0.48 | 0.25 | 1.00 |
| AFL LC ultra | 0.15 | 0.60 | 0.30 | 1.20 |
| Fischer FiberOptic | 0.20 | 0.80 | 0.45 | 1.80 |
| Corning UniCam 0252 UPC (2015) | 0.2 | 0.80 | 0.5 | 2.00 |
| Corning UniCam 0250 UPC (2018) | 0.3 | 1.20 | 0.5 | 2.00 |
For the same four pairs, the sum of typical values ranges from 0.48 dB to 1.20 dB. The 0.1 dB difference between the two Corning typical values grows to 0.4 dB over four pairs. This calculation does not include fusion splice loss, fibre attenuation or margin, and the value of one pair is not carried over to another product. Numbers printed in a datasheet and numbers calculated by DMS are not mixed in one cell and the latter are marked as a DMS calculation.
The limits of this material are clear as well. The texts of IEC 61753-1, IEC 61300-3-34, IEC 61300-3-6, IEC 61300-2-2 and Telcordia GR-326 were not read. Whether each document is the current revision, whether it matches the product sold today, and why the numbers changed were not confirmed, and the makers were not contacted. The Huber+Suhner document did not open at its address and was not used.
Checklist
-
Did you write on one line, with the document number, whether the insertion loss value is typical, mean or maximum and whether the partner is a master or random connector?
-
Did you carry reflectance and return loss over with a matching sign and unit, and separate the typical line from the minimum line and mated from unmated?
-
Did you check that the loss change allowed and the test method sit next to the mating cycle count, and write that the pass criterion was not confirmed when they do not?
-
Did you write which table a grade name such as Grade B comes from, with the test wavelength and the sample share condition?
-
When datasheets of one product family print different numbers, did you record both values with document number and date instead of choosing one?
Review questions
1. Four mated pairs are made with Senko Premium SM connectors. What are the mean and maximum for random mating when added over four pairs?
Answer and explanation: The 0.12 dB mean times 4 gives 0.48 dB as the expected loss, and the 0.25 dB maximum times 4 gives 1.00 dB as the conservative upper plan. Note that the maximum applies to more than 97% of samples and so is not an absolute ceiling, and that summing is a planning convention.
2. The typical insertion loss of Corning UniCam single-mode UPC is 0.2 dB in the 2015 document and 0.3 dB in the 2018 document. How does the four-pair typical sum change, and which document do you use?
Answer and explanation: 0.2 times 4 is 0.8 dB and 0.3 times 4 is 1.2 dB, a difference of 0.4 dB. The documents do not say why the numbers changed, so choose the document that matches the lot and region of the product bought and record the value of the document you did not use as well, with its document number.
3. One datasheet prints reflectance of -55 dB or lower and another prints return loss of above 50 dB. Which is stricter?
Answer and explanation: With the sign removed, -55 dB or lower points the same way as a return loss of 55 dB or more, which is 5 dB stricter than above 50 dB. Compare them only after checking that both values are for the same state (UPC or APC, typical or minimum).
Sources
-
Senko: Interconnect Catalogue (page code E-3.3, no document date printed) · PDF pages 4–5 connector grade and insertion loss tables, pages 64–67 field installable connectors, page 79 zirconia sleeves
-
Senko: Micro LC Connector datasheet (DS-LC-000005 Rev A) · page 2 optical data and note
-
AFL: Optical Connectivity catalogue · PDF page 7 (PP-2-00045 Rev 6, printed date 11.2.2020), page 9 (PP-2-00105 Rev 9, 3.10.2022), page 18 (PP-2-00047 Rev 4, 8.10.2026), page 100 (PP-2-00415 Rev 1, 7.28.2026)
-
Corning: UniCam high-performance single-mode connectors 0252_NAFTA_AEN (revision date 2015-01-06) · pages 1–2
-
Corning: UniCam high-performance connectors 0250_EMEA_BEN (revision date 2018-01-22) · pages 1–3
-
Panduit: SC OptiCam pre-polished connectors specification (FBSP17-WW-ENG, July 2024) · pages 1–2
-
Panduit: LC OptiCam pre-polished connectors specification (July 2024) · pages 1–2
-
Fischer Connectors: FiberOptic series technical specification (version 4.9, May 2026) · pages 29–30
-
ITU-T L.404 (August 2017): Field mountable single-mode optical fibre connectors · clause 8.1.1 Table 8-1, clause 8.1.2 Table 8-2, clause 8.1.4