The Table Is a Suggestion
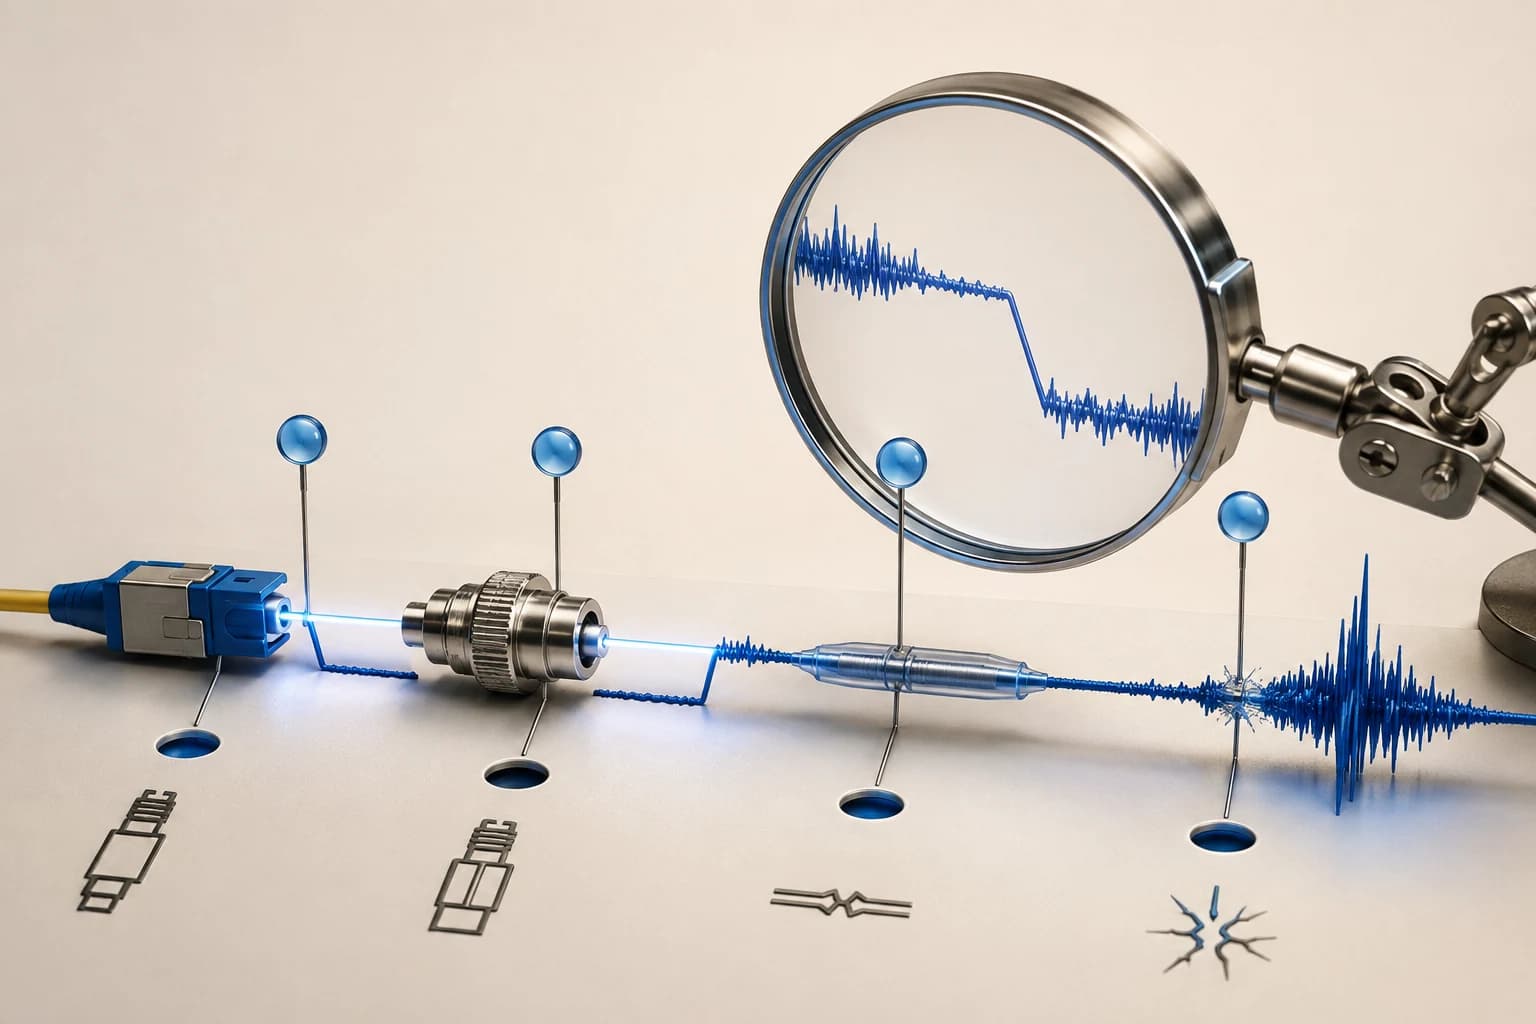
Modern OTDRs analyse the trace and produce an event table: a list of distances, loss values, reflectance values and pass/fail marks. It is genuinely useful and it saves time.
It is also generated by an algorithm working on a noisy curve, and it is wrong often enough that accepting it without inspection is a habit that eventually produces an embarrassing report.
The professional habit is: read the table, then verify the events that matter against the trace itself.
What Each Column Is Telling You
Distance. Optical distance along the fiber, derived from time and the refractive index setting. If the index is wrong, every distance is proportionally wrong. Check that it matches the fiber in the ground, not whatever the instrument defaulted to.
Loss. The step down at that event. For a splice this is the splice loss. For a connector it is the mated pair loss.
Reflectance. How much light came back. Large negative numbers are good — -60 dB reflects far less than -35 dB. Connectors reflect; fusion splices essentially do not.
Attenuation (dB/km). The slope of the section following the event. This is the one people ignore, and it is often the most informative column. A section whose slope is meaningfully higher than the fiber specification is telling you something is wrong along that whole span, not at a point — usually pressure, water, or the wrong fiber type.
Verify with Markers
For any event that matters, place the cursors yourself.
The reason is that automated loss calculation depends on where the software decided the "before" and "after" straight sections are. When events sit close together, or the trace is noisy, those fits go wrong. Placing markers on clean straight sections either side gives you the number you can defend.
This matters most for:
- Events near the far end, where signal is weakest and noise is worst.
- Events close to each other, where the software may merge them.
- Any event you intend to put in a report as a failure. Before you tell someone their splice is bad, be sure the marker placement supports it.
The Artefacts That Fool the Software
Ghosts. A strong reflection can bounce back and forth and appear as a second, fainter event at a multiple of the real distance. If an event appears at exactly twice the distance of a strong reflector and has no loss associated with it, suspect a ghost. Change the range or pulse width and see whether it moves.
Gainers. A splice that shows negative loss. As covered in the fault-finding lesson, this is a backscatter mismatch between two dissimilar fibers, not a physical impossibility being observed. The real loss comes from averaging both directions.
Merged events. Two splices closer together than the pulse width can resolve appear as one event with their combined loss. The table will report one splice with a suspiciously large loss. Re-measure with a shorter pulse before you go dig anything up.
End-of-fiber confusion. An unterminated fiber end produces a strong reflection; a well-terminated or angled end may produce almost none. An APC-terminated end can look like a break on a quick reading. Check against the expected length.
The Habit That Catches Most Errors
Compare the trace against the previous one.
Acceptance traces stored at handover, and any trace taken during a later repair, form a baseline. When you take a new trace, load the old one alongside it. Differences jump out in a way that absolute values never do. An event that was 0.08 dB and is now 0.31 dB is a story; 0.31 dB on its own is just a number near a threshold.
This is the practical argument for the documentation lesson later in this chapter: traces are only worth taking if they can be found again.
A Working Order
- Set the correct refractive index and wavelength.
- Capture with a short pulse for the near section, and a longer pulse for the full span.
- Read the event table for orientation.
- Verify the significant events with manual markers.
- Check the dB/km slope of each section against specification.
- Compare with the baseline trace if one exists.
- Measure from the other end and average splice losses before reporting.
Steps 5 and 7 are the ones most often skipped, and they are the ones that separate a trace reading from a diagnosis.
Summary
- The event table is algorithmic output on a noisy curve. Verify what matters with your own markers.
- The dB/km column often reveals distributed problems that point events hide.
- Ghosts, gainers, merged events and APC ends all fool automated analysis in predictable ways.
- Comparing against a baseline trace turns ambiguous numbers into clear findings.
- Average both directions before you report a splice as failing.